Fig. 4
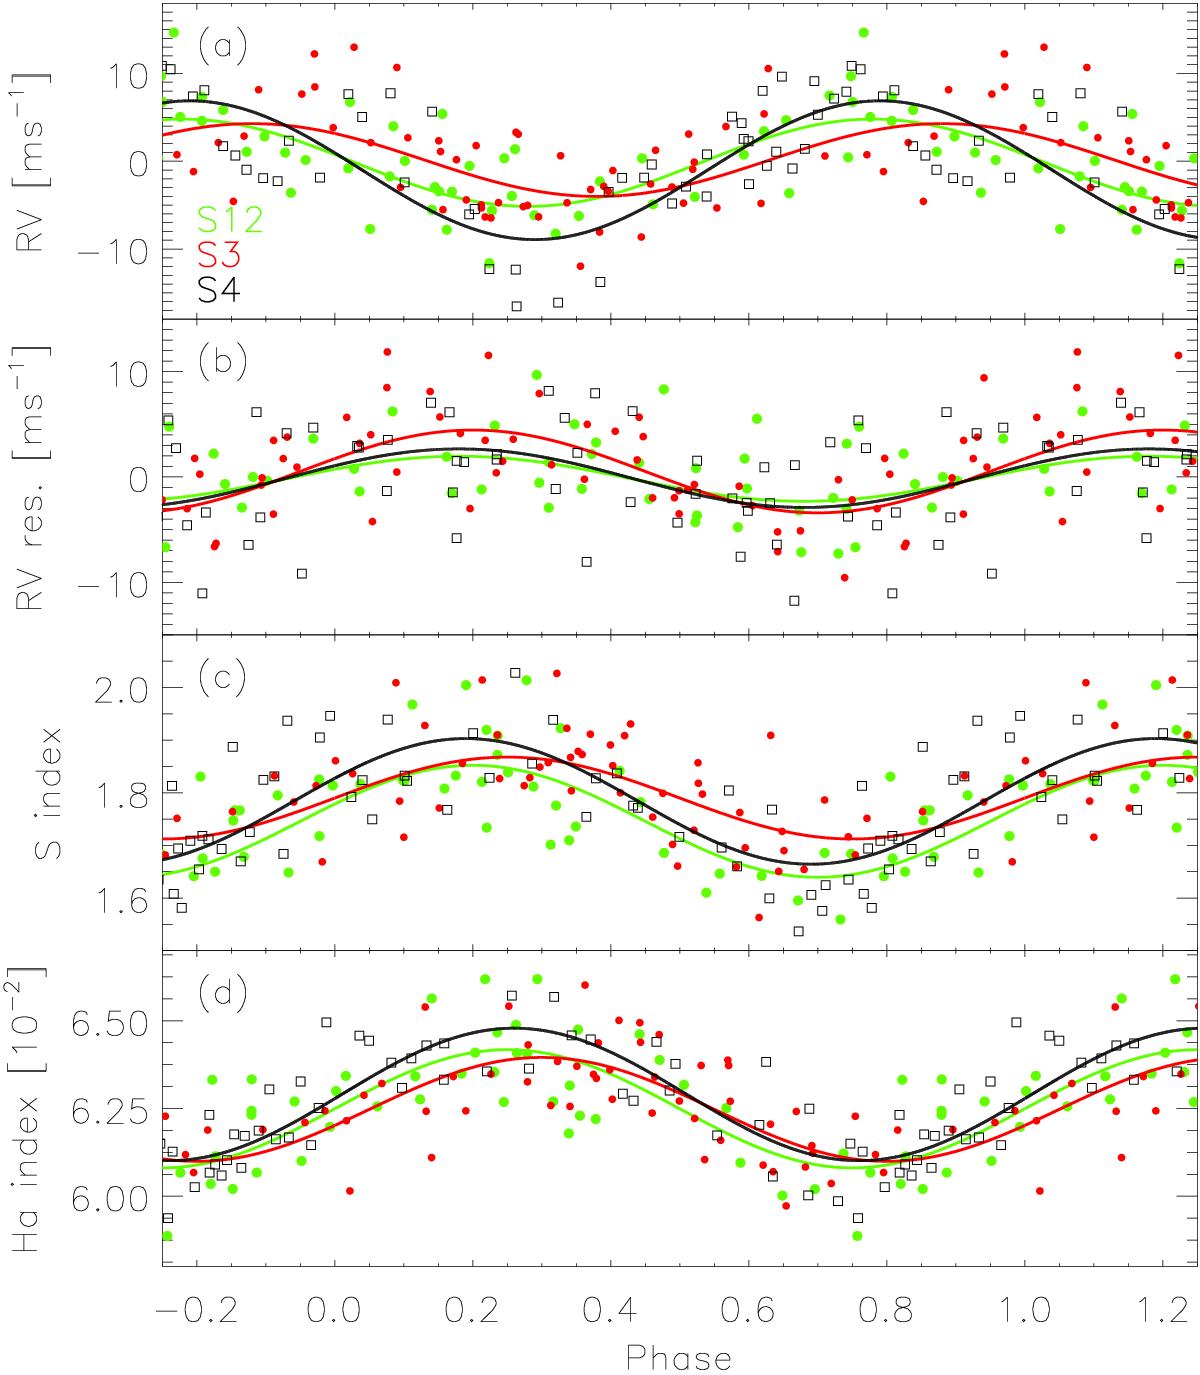
Illustration of changing characteristics of signals in RV, RV residual, and activity index data of GJ 3942. It is grouped into seasons 1 & 2 (S12, green dots), season 3 (S3, red dots), and season 4 (S4, black squares). The best purely sinusoidal fit for each dataset is shown. Panel a shows the RV data folded in phase with a 16.29-day period; panel b the residuals after correcting for the best sinusoidal 16.3-day period fit and phase folded with 6.91 days; panel c the S index data folded in phase with a 16.26-day period; and panel d the Hα index data phase folded with 16.25 days.
Current usage metrics show cumulative count of Article Views (full-text article views including HTML views, PDF and ePub downloads, according to the available data) and Abstracts Views on Vision4Press platform.
Data correspond to usage on the plateform after 2015. The current usage metrics is available 48-96 hours after online publication and is updated daily on week days.
Initial download of the metrics may take a while.