Fig. 3
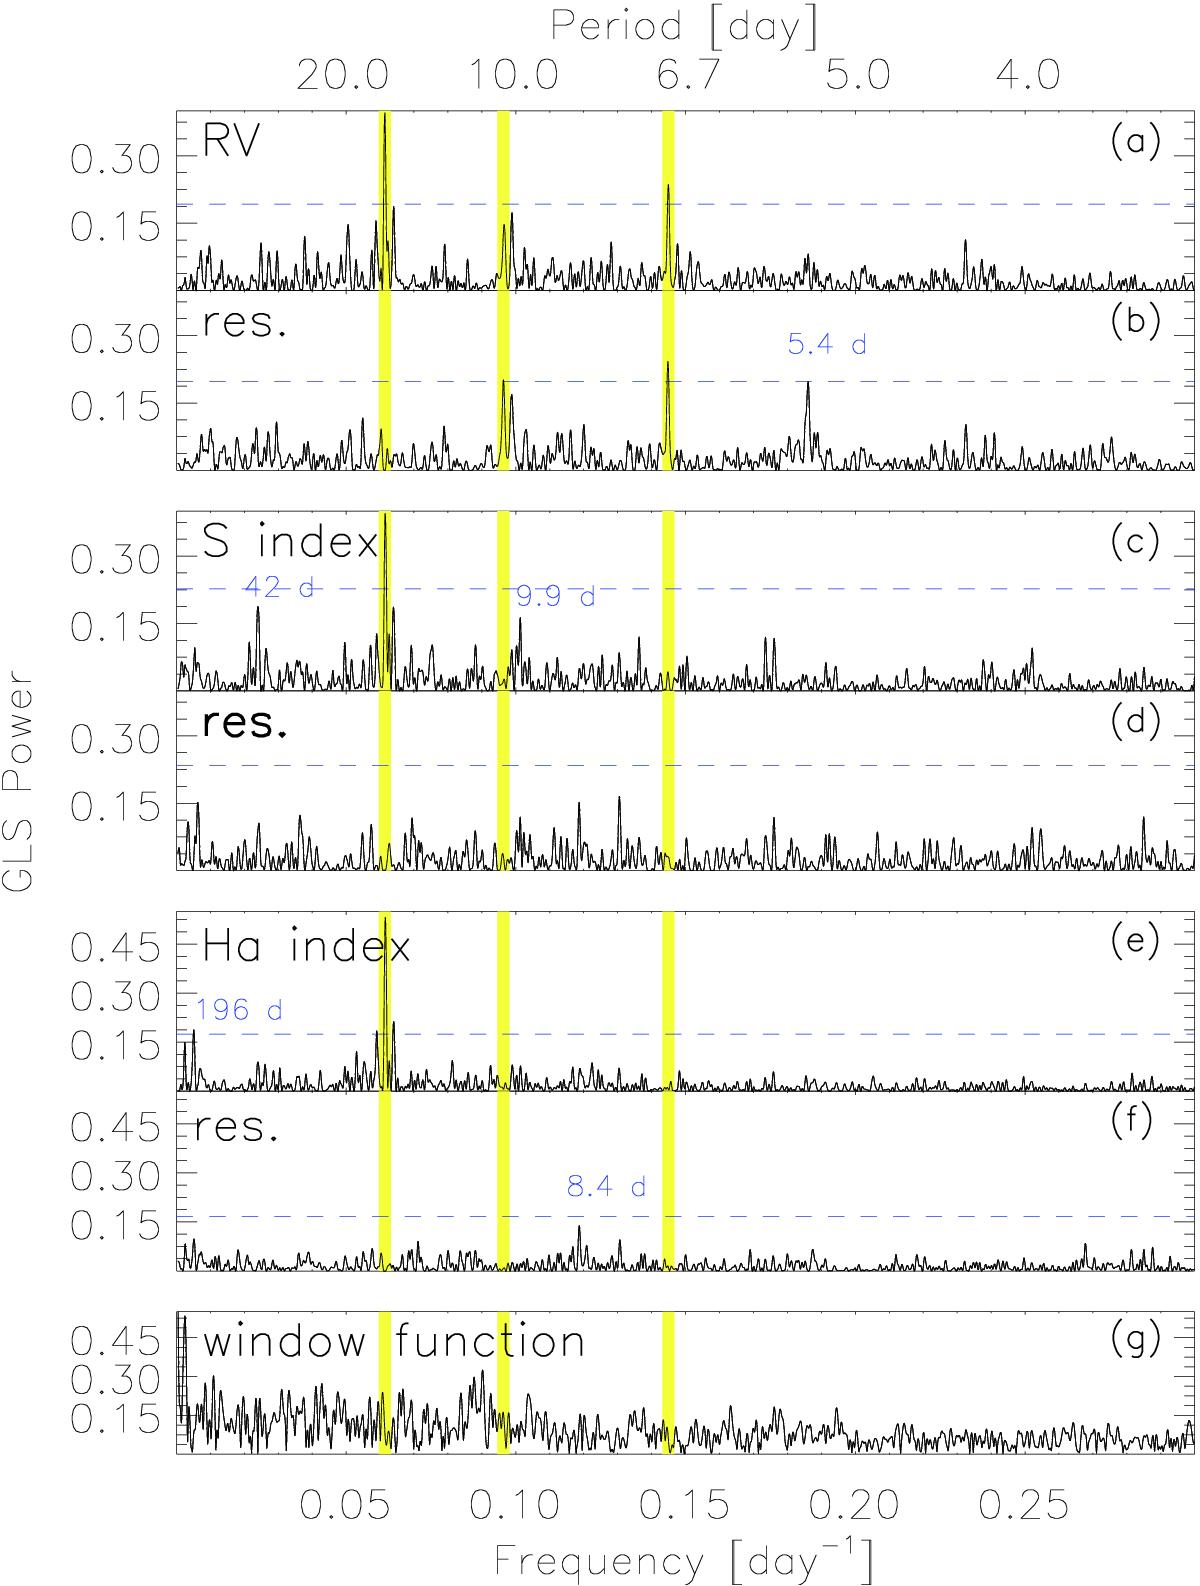
Generalized Lomb-Scargle periodograms of the de-trended time series data and of the residuals after correcting for the 16.3-day signal with a simple sinusoidal fit. In panels a and b this is shown for the radial velocities, in panels c and d for the S index, and in panels e and f for the Hα index. Additionally, we show in panel g the window function of the time series. Yellow lines indicate the important periodic signals for GJ 3942, namely 16.3, 10.4, and 6.9 days, and we also show additional periodicities mentioned in the text. The dashed blue horizontal line shows the 1% FAP level of the respective dataset.
Current usage metrics show cumulative count of Article Views (full-text article views including HTML views, PDF and ePub downloads, according to the available data) and Abstracts Views on Vision4Press platform.
Data correspond to usage on the plateform after 2015. The current usage metrics is available 48-96 hours after online publication and is updated daily on week days.
Initial download of the metrics may take a while.