Fig. 2
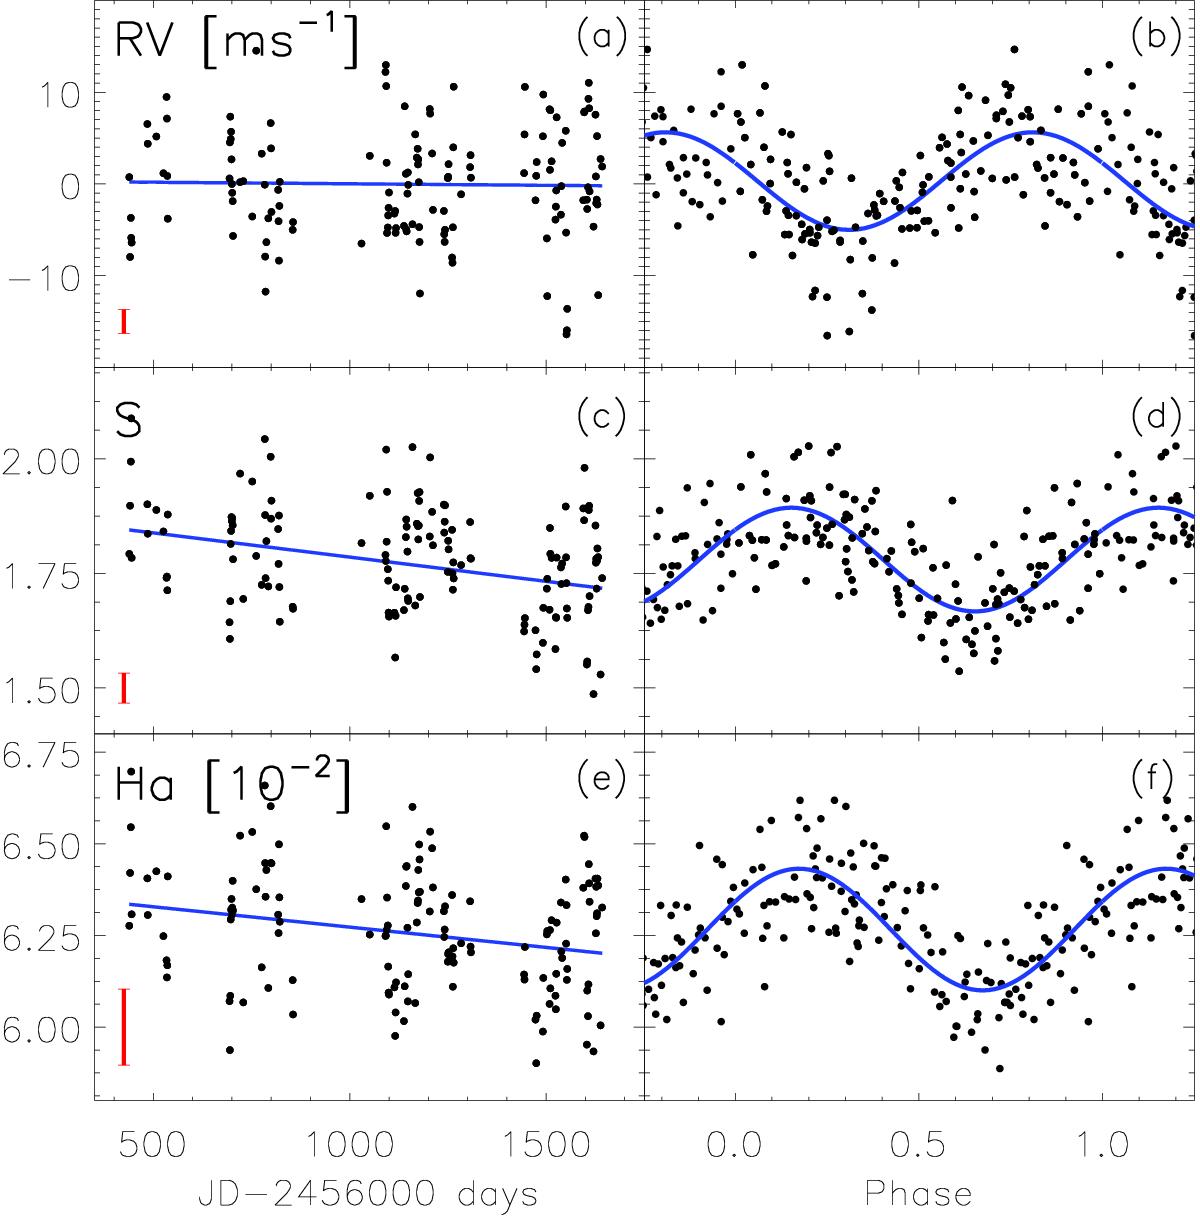
Time series data of (from top to bottom) radial velocities (in m s-1), S index, and Hα index (in 10-2) are shown in panels a, c, and e, respectively, as observed (black dots) and their linear trend is indicated by the blue lines. The mean errors of each dataset are illustrated by the red line on the lower left side of each panel. Panels b, d, and f show the de-trended data (i.e., linear fit subtracted) folded to the most prominent periodicity at 16.3 days and with zero phase corresponding to the first observation (black dots) and a simple sinusoidal fit (blue curve).
Current usage metrics show cumulative count of Article Views (full-text article views including HTML views, PDF and ePub downloads, according to the available data) and Abstracts Views on Vision4Press platform.
Data correspond to usage on the plateform after 2015. The current usage metrics is available 48-96 hours after online publication and is updated daily on week days.
Initial download of the metrics may take a while.