Fig. 14
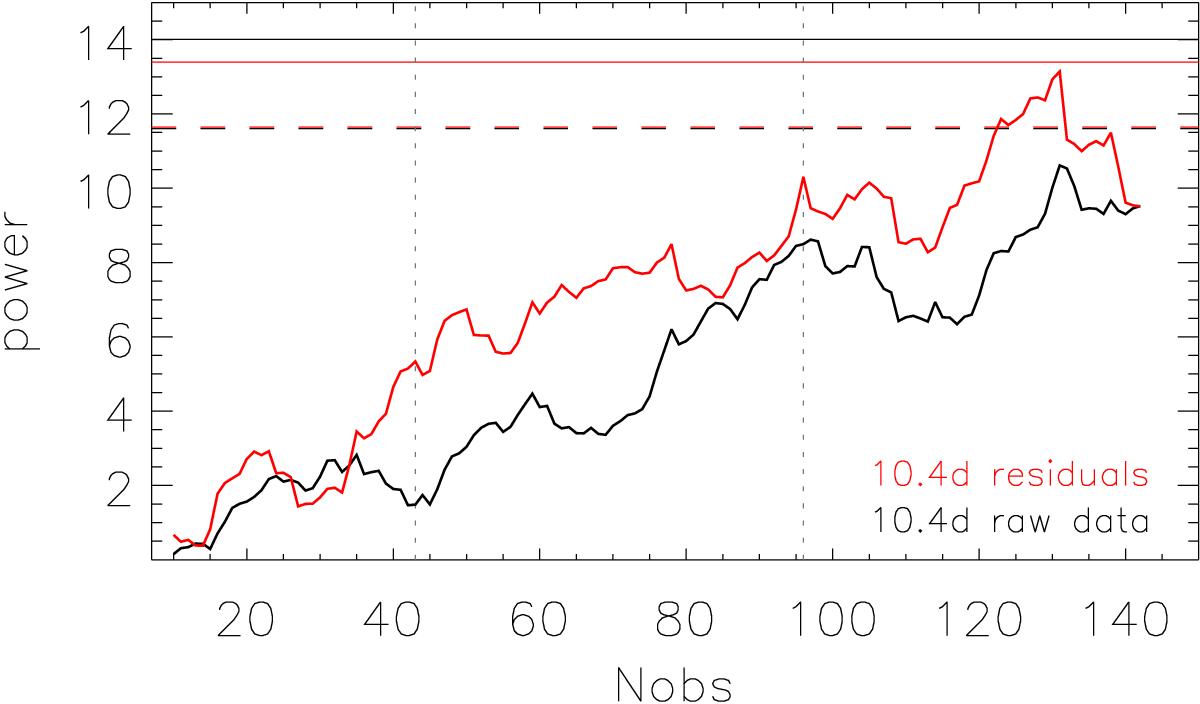
Evolution of periodogram power of the signal at around 10.4 days with the number of observations. We use the residuals after the subtraction of the 16.3- and 6.9-day signals of the best fit following our MA method in red and in the original data in black. The solid and dashed lines correspond to the 0.1 and 1% FAP levels, respectively.
Current usage metrics show cumulative count of Article Views (full-text article views including HTML views, PDF and ePub downloads, according to the available data) and Abstracts Views on Vision4Press platform.
Data correspond to usage on the plateform after 2015. The current usage metrics is available 48-96 hours after online publication and is updated daily on week days.
Initial download of the metrics may take a while.