Fig. 13
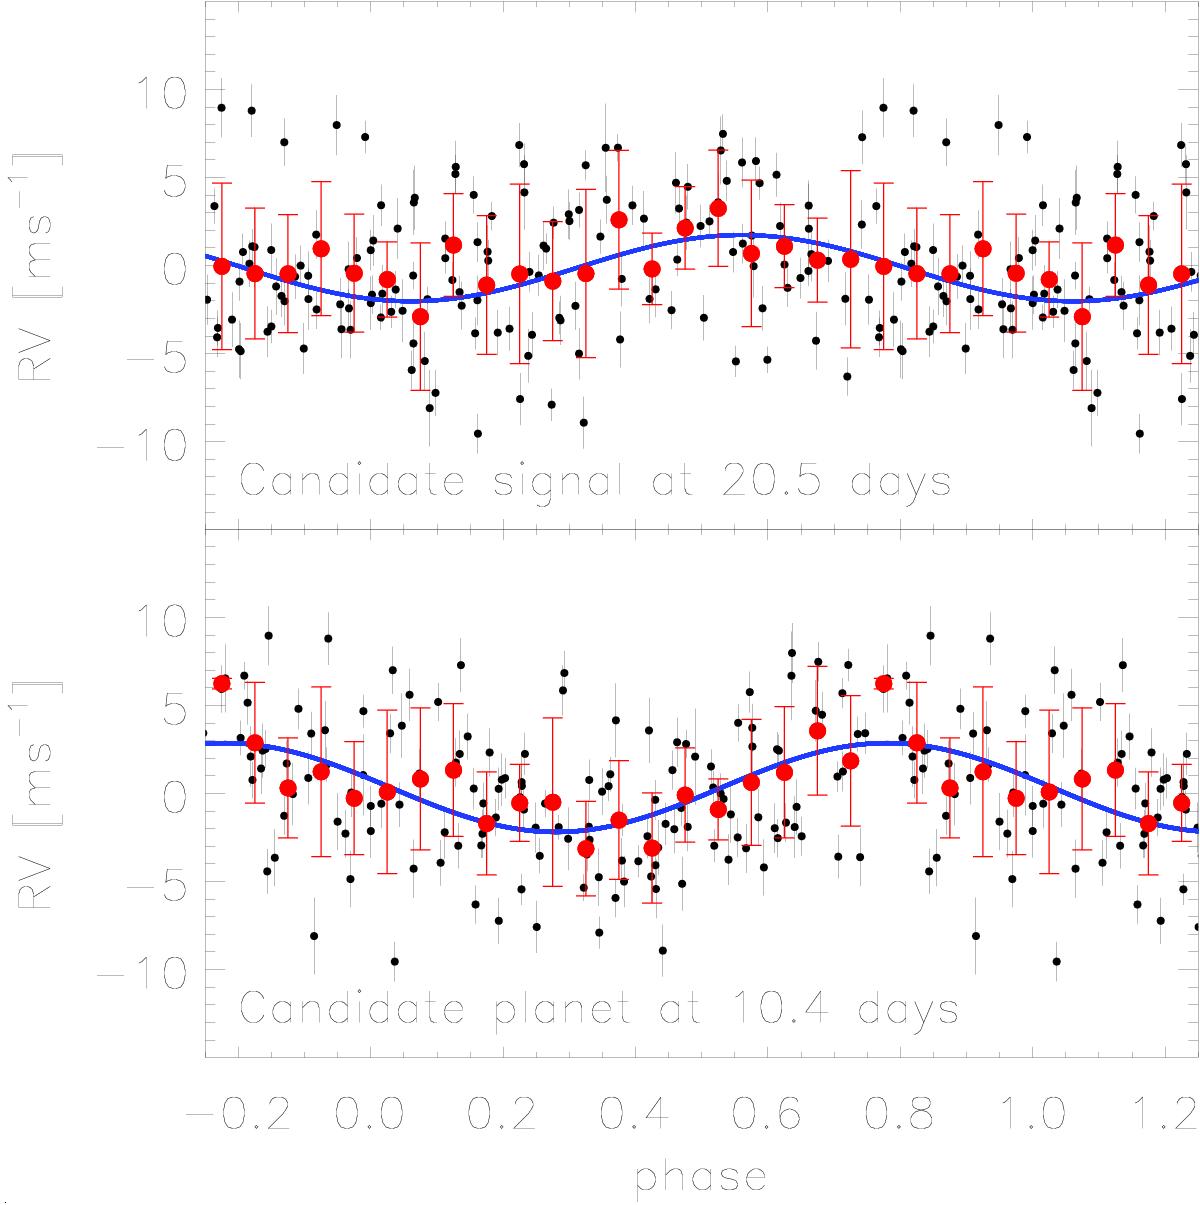
Residuals and errors of the RVs in black dots folded to a period of 20.5 (top panel) and 10.4 days (bottom panel) with semi-amplitudes of 1.88 and 2.52 m s-1, respectively. We used the data after pre-whitening the 16.3-day signal (top) and the 16.3- and 6.9-day signal (bottom) using the MA method. The red dots correspond to averages in 0.05 phase intervals. We show the best sinusoidal fits in blue.
Current usage metrics show cumulative count of Article Views (full-text article views including HTML views, PDF and ePub downloads, according to the available data) and Abstracts Views on Vision4Press platform.
Data correspond to usage on the plateform after 2015. The current usage metrics is available 48-96 hours after online publication and is updated daily on week days.
Initial download of the metrics may take a while.