Fig. 3
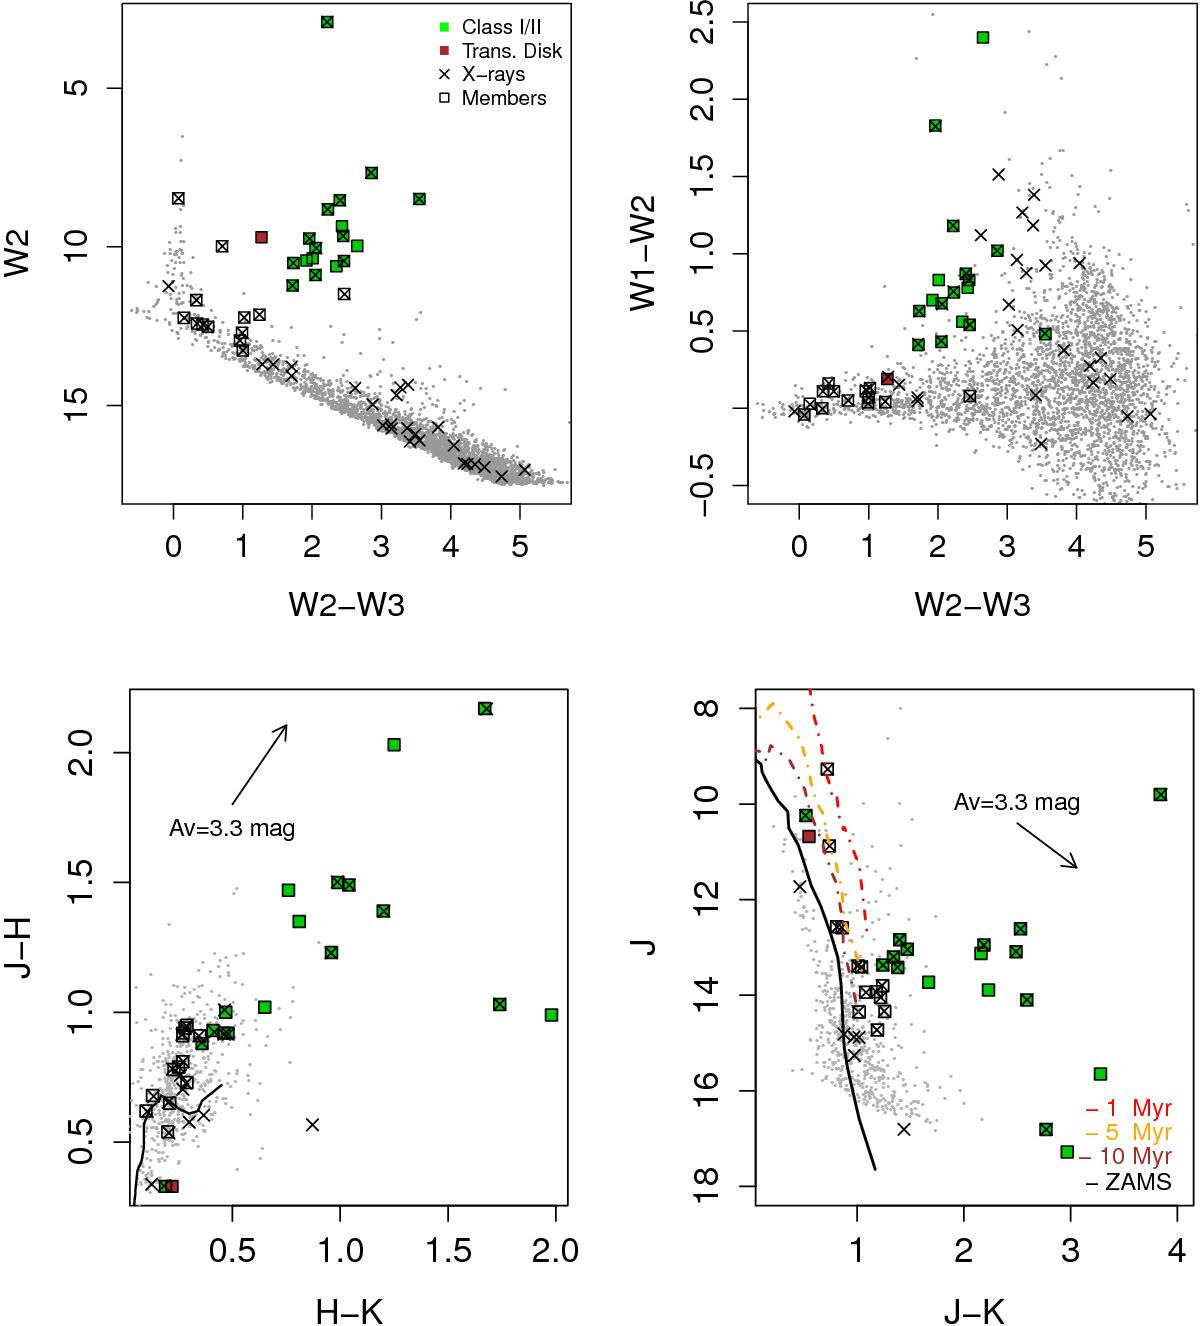
Top panels: WISE color–color and color–magnitude diagrams of the objects in the XMM-Newton field of view. W1, W2, and W3 refer to the 3.4 μm, 4.6 μm, and 12 μm WISE bands. Selected members of the V1818 Ori group are plotted as open squares. Bottom panels: 2MASS color–color and color–magnitude diagrams. The solid line represents the zero-age main sequence, and dashed lines are isochrones at 1, 5, and 10 Myr, respectively, for a distance of 270 pc (the distance moduli for 270 pc, 400 pc, and 900 pc are ~7.2 mag,~8 mag, and ~9.1 mag, respectively). The reddening vector corresponding to AV = 3.3 mag represents the average extinction in the XMM-Newton field.
Current usage metrics show cumulative count of Article Views (full-text article views including HTML views, PDF and ePub downloads, according to the available data) and Abstracts Views on Vision4Press platform.
Data correspond to usage on the plateform after 2015. The current usage metrics is available 48-96 hours after online publication and is updated daily on week days.
Initial download of the metrics may take a while.