Fig. 5

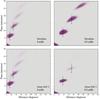
Time-distance diagrams ![]() using a (Dirichlet) and (Atmo SAI 1) BCs by selecting the frequencies around 3 mHz (left) and 6.5 mHz (right). The cross-covariance is filtered using a phase speed filter centered at 125.2 km s-1 for 3 mHz and 250.4 km s-1 for 6.5 mHz and a width of 12.3 km s-1. The dashed black lines indicate the location of the cuts shown at the bottom in order to emphasize the amplitude ratios between the first and second skip.
using a (Dirichlet) and (Atmo SAI 1) BCs by selecting the frequencies around 3 mHz (left) and 6.5 mHz (right). The cross-covariance is filtered using a phase speed filter centered at 125.2 km s-1 for 3 mHz and 250.4 km s-1 for 6.5 mHz and a width of 12.3 km s-1. The dashed black lines indicate the location of the cuts shown at the bottom in order to emphasize the amplitude ratios between the first and second skip.
Current usage metrics show cumulative count of Article Views (full-text article views including HTML views, PDF and ePub downloads, according to the available data) and Abstracts Views on Vision4Press platform.
Data correspond to usage on the plateform after 2015. The current usage metrics is available 48-96 hours after online publication and is updated daily on week days.
Initial download of the metrics may take a while.