Fig. 4
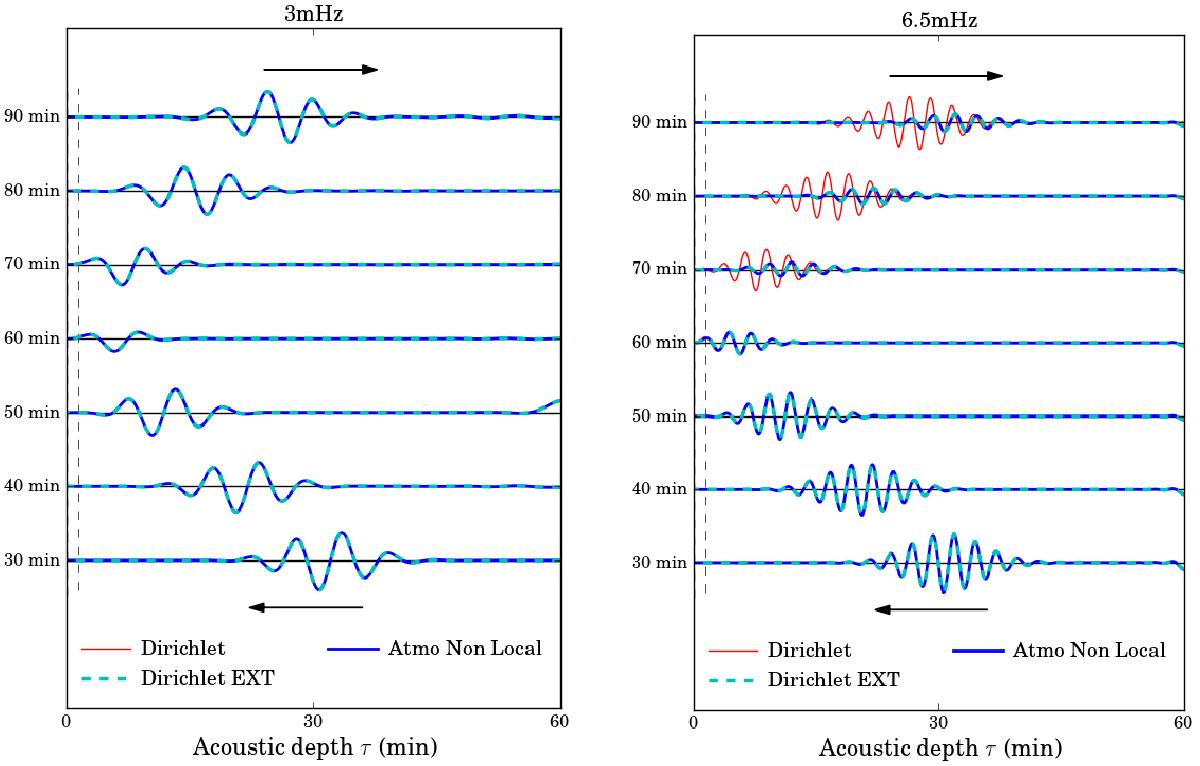
Temporal cross-covariance ![]() computed with (Atmo Non Local) and (Dirichlet) boundary conditions, originating from the center, with frequencies selected around 3 mHz (left panel) and 6.5 mHz (right panel). As a comparison, we also plot the cross-covariance when using the (Reference) BC (dashed cyan line). The signal is multiplied by exp(t/ 90min) to counteract the effect of the damping, and normalized by the maximum of its amplitude at t = 30 min. The amplitude is plotted as a function of the acoustic depth
computed with (Atmo Non Local) and (Dirichlet) boundary conditions, originating from the center, with frequencies selected around 3 mHz (left panel) and 6.5 mHz (right panel). As a comparison, we also plot the cross-covariance when using the (Reference) BC (dashed cyan line). The signal is multiplied by exp(t/ 90min) to counteract the effect of the damping, and normalized by the maximum of its amplitude at t = 30 min. The amplitude is plotted as a function of the acoustic depth ![]() for better readability of near-surface behavior. The dashed line indicates the solar surface.
for better readability of near-surface behavior. The dashed line indicates the solar surface.
Current usage metrics show cumulative count of Article Views (full-text article views including HTML views, PDF and ePub downloads, according to the available data) and Abstracts Views on Vision4Press platform.
Data correspond to usage on the plateform after 2015. The current usage metrics is available 48-96 hours after online publication and is updated daily on week days.
Initial download of the metrics may take a while.