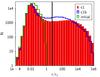
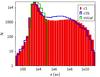
Fig. 4

Final distribution for the sets c1 (red), and c1b (open blue) after T = 10 Gyr of evolution. In green we include the histogram of the initial distribution of both samples. The top and bottom panels correspond to the final separation divided by rJ and the final semi-major axis, respectively. The black vertical line in the top graph corresponds to ~5 rJ.
Current usage metrics show cumulative count of Article Views (full-text article views including HTML views, PDF and ePub downloads, according to the available data) and Abstracts Views on Vision4Press platform.
Data correspond to usage on the plateform after 2015. The current usage metrics is available 48-96 hours after online publication and is updated daily on week days.
Initial download of the metrics may take a while.