Fig. 2
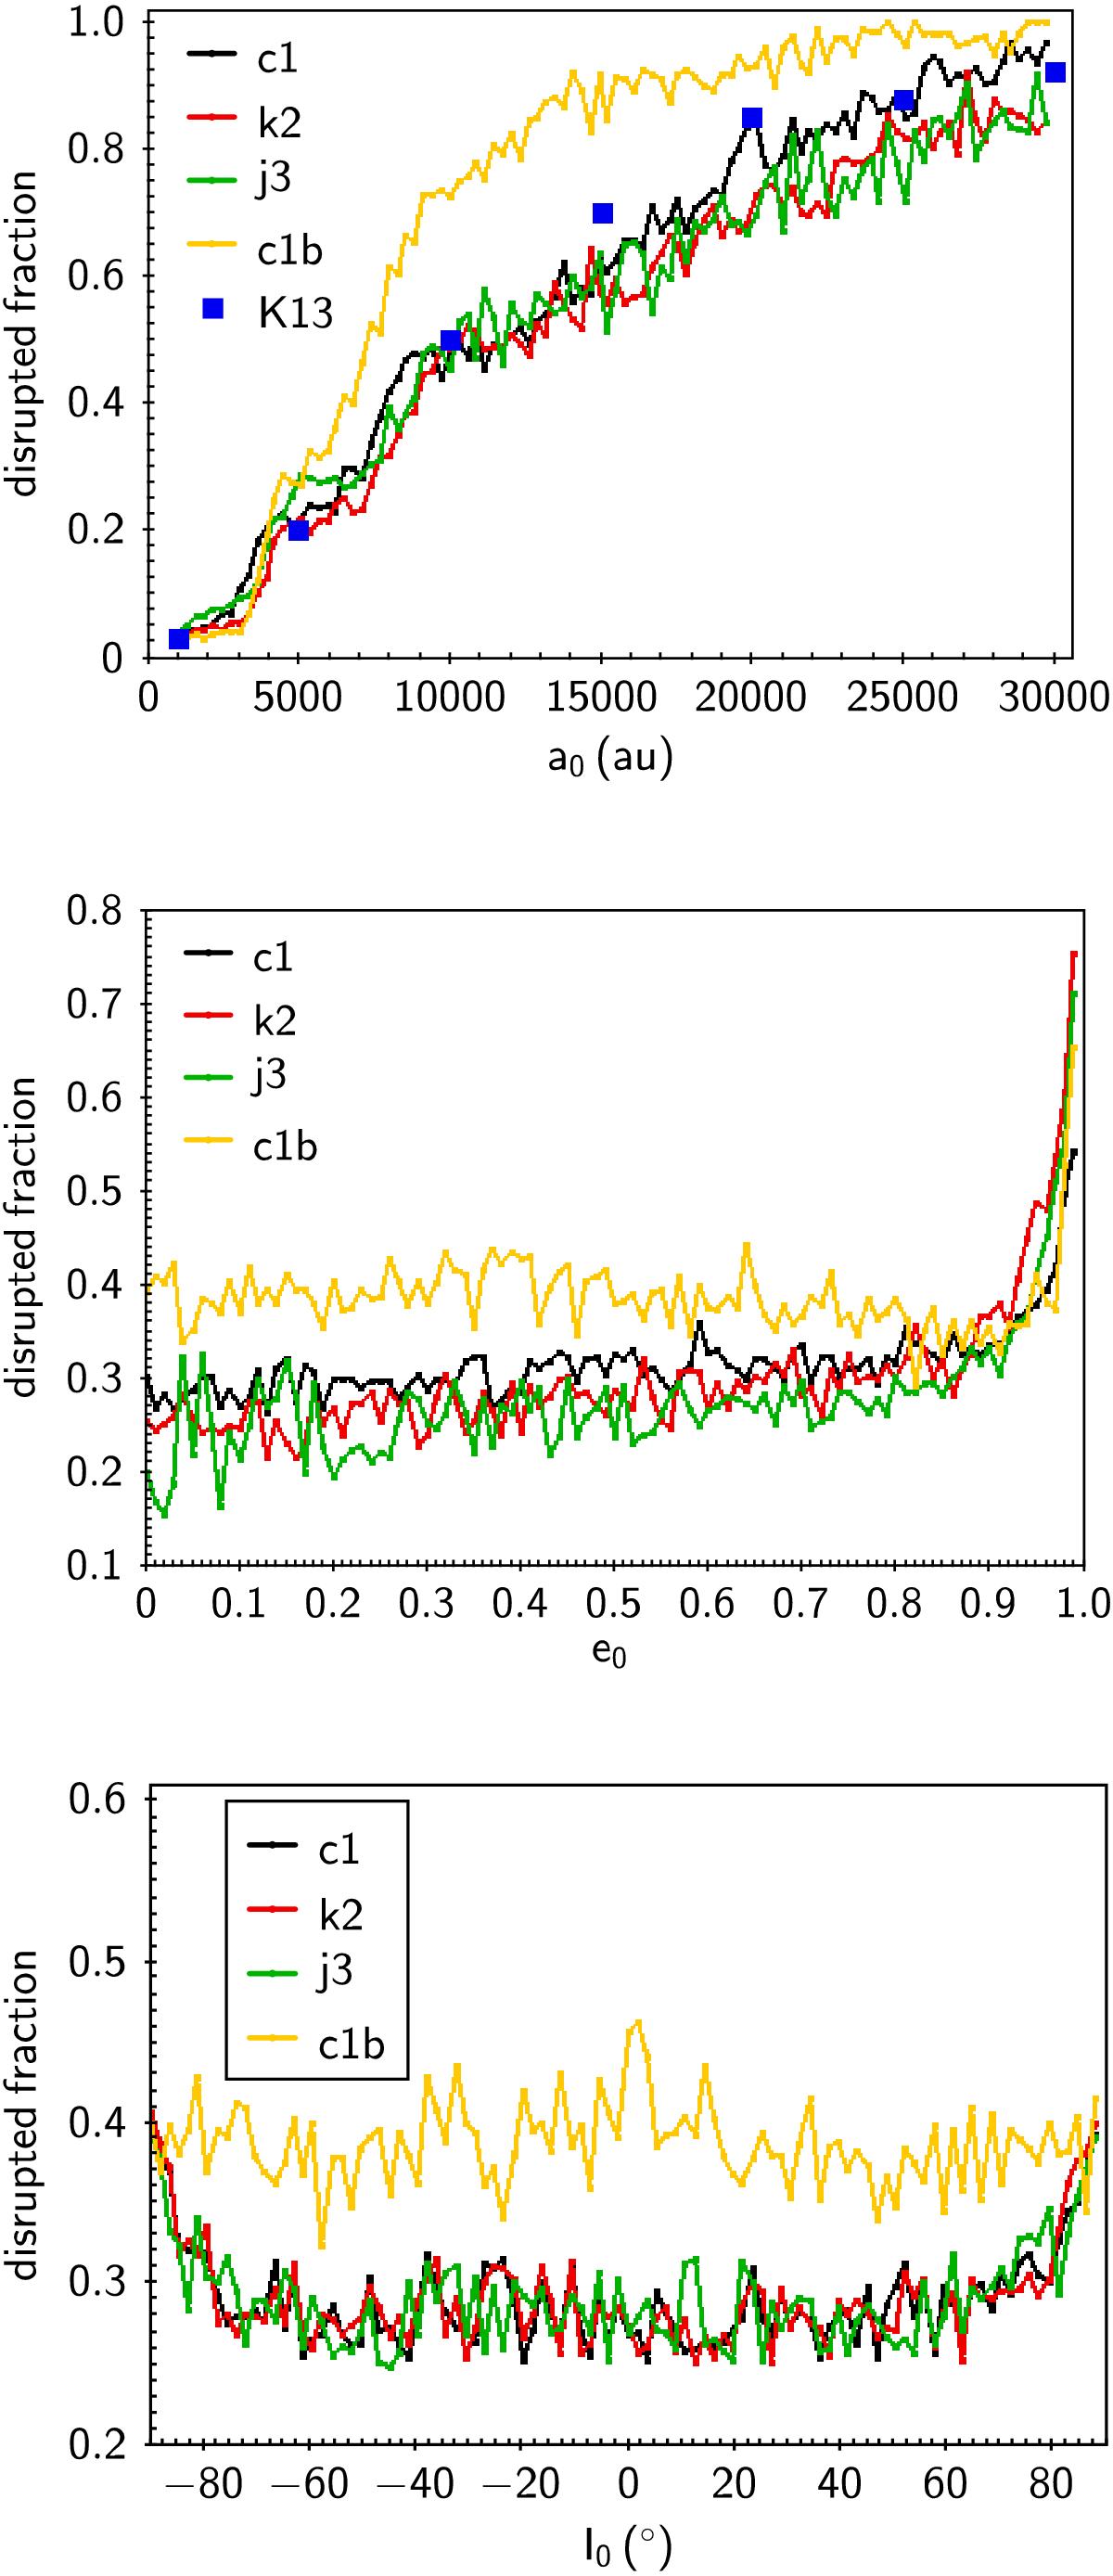
Top panel: fraction of disrupted WBS in the initial range a0 ∈ (1000, 30 000) au. The blue squares are results taken from the Fig. S8 of Kaib et al. (2013) included for comparison. Middle and bottom panels: fraction of disrupted WBS as a function of the initial eccentricity and inclination, respectively. In the three graphs the sets c1, c1b, k2, and j3 are shown in black, yellow, red, and green, respectively.
Current usage metrics show cumulative count of Article Views (full-text article views including HTML views, PDF and ePub downloads, according to the available data) and Abstracts Views on Vision4Press platform.
Data correspond to usage on the plateform after 2015. The current usage metrics is available 48-96 hours after online publication and is updated daily on week days.
Initial download of the metrics may take a while.