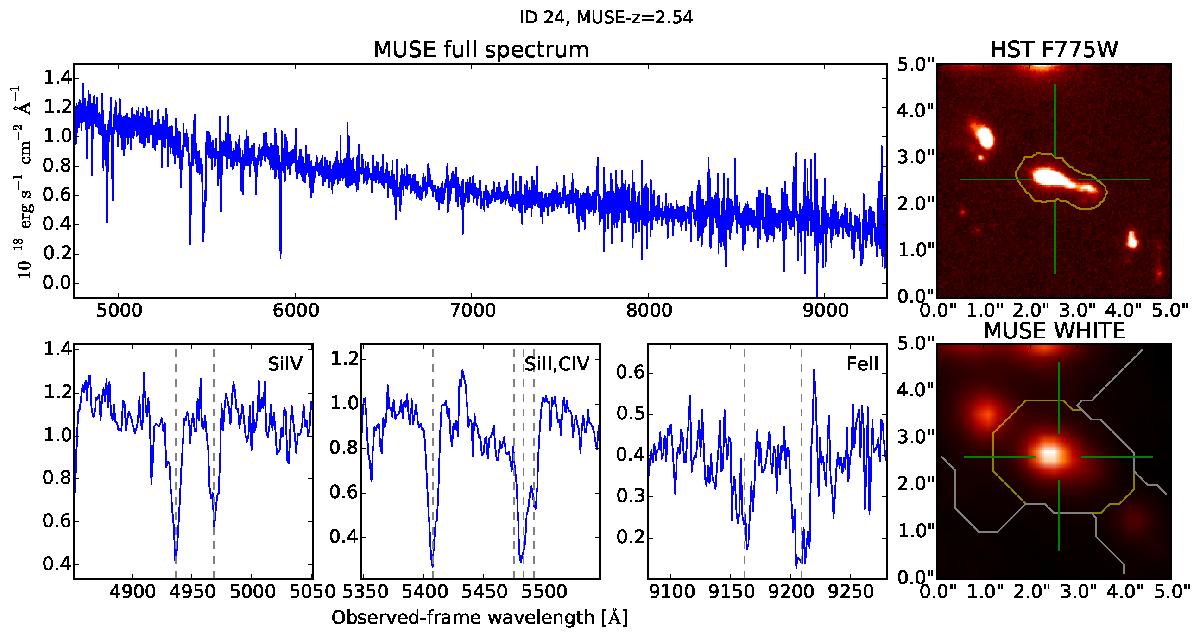
Fig. 6

Full MUSE spectrum and a zoomed-in portion of the SiIV, SiII and CIV, and FeII absorption features. The HST F775W and the MUSE white-light images are shown on the right. The yellow contours in the images are the boundary of the UVUDF catalog segmentation for the object, but those in the MUSE white-light image are convolved with the MUSE beam size. The white boundaries indicate masked objects excluded from local sky residual estimates. The green cross indicates the central position of the extracted object. The ID number and measured redshift are indicated at the top.
Current usage metrics show cumulative count of Article Views (full-text article views including HTML views, PDF and ePub downloads, according to the available data) and Abstracts Views on Vision4Press platform.
Data correspond to usage on the plateform after 2015. The current usage metrics is available 48-96 hours after online publication and is updated daily on week days.
Initial download of the metrics may take a while.


