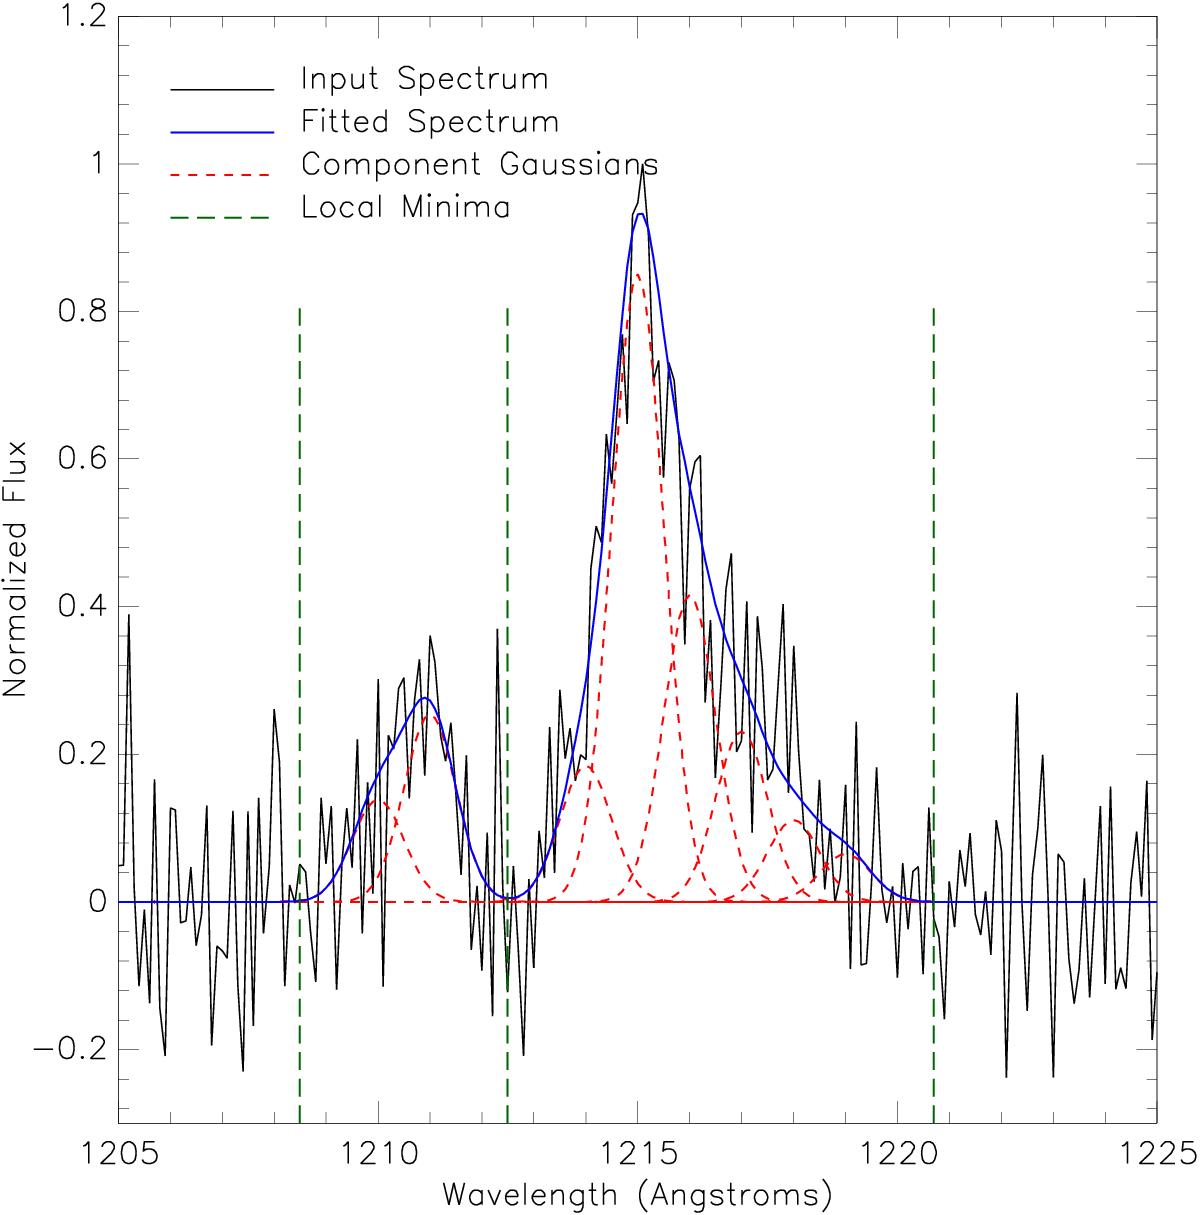
Fig. 2

Demonstration of the complex fitting for a Lyα emission line presenting blue and red bumps. The fitting is performed on a simulated spectrum (black line) to better illustrate the procedure (the flux is in arbitrarily units). In the real data, the final fit is usually comprised of fewer components. The dashed red lines are the individual Gaussian components and the solid blue line is the total of these components (the final fit). The vertical green dashed lines indicate the local minima. We use the Lyα peak position to measure the redshift (see Sect. 3.2).
Current usage metrics show cumulative count of Article Views (full-text article views including HTML views, PDF and ePub downloads, according to the available data) and Abstracts Views on Vision4Press platform.
Data correspond to usage on the plateform after 2015. The current usage metrics is available 48-96 hours after online publication and is updated daily on week days.
Initial download of the metrics may take a while.


