Fig. 9
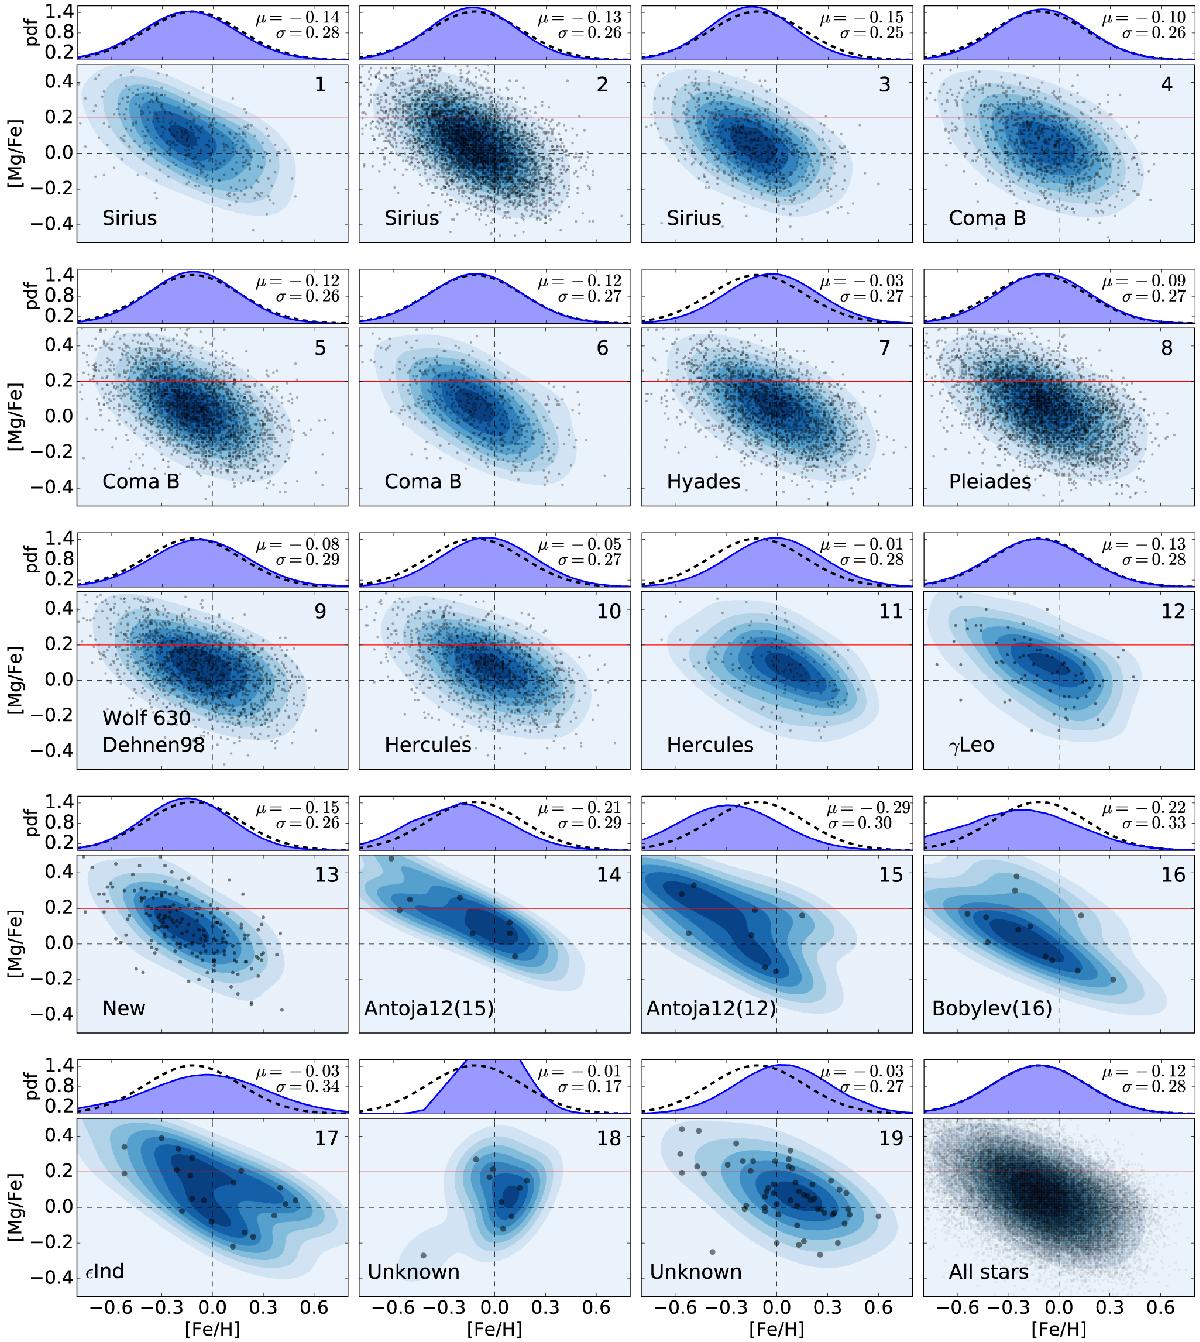
[Mg/Fe]-[Fe/H] diagram for kinematic structures detected for the scale J = 3. Numbers on each panel correspond to structures 1–19 as stated in the legend of Fig. 7. The last plot corresponds to the total sample with limits on S/N > 40 (47 849 stars). The red line at each density plot corresponds to [Mg/Fe] = 0.2 and divides the total sample into thick (above the line) and thin (below the line) disks. Dashed black lines show [Fe/H] = 0 and [Mg/Fe] = 0. Scatter plots at each density map show positions of individual stars on the diagram. Histograms at the top of each panel show the metallicity distribution for the total sample (black dashed line) and for each group (solid violet distribution). Values of μ and σ represent the violet distribution.
Current usage metrics show cumulative count of Article Views (full-text article views including HTML views, PDF and ePub downloads, according to the available data) and Abstracts Views on Vision4Press platform.
Data correspond to usage on the plateform after 2015. The current usage metrics is available 48-96 hours after online publication and is updated daily on week days.
Initial download of the metrics may take a while.