Fig. 7
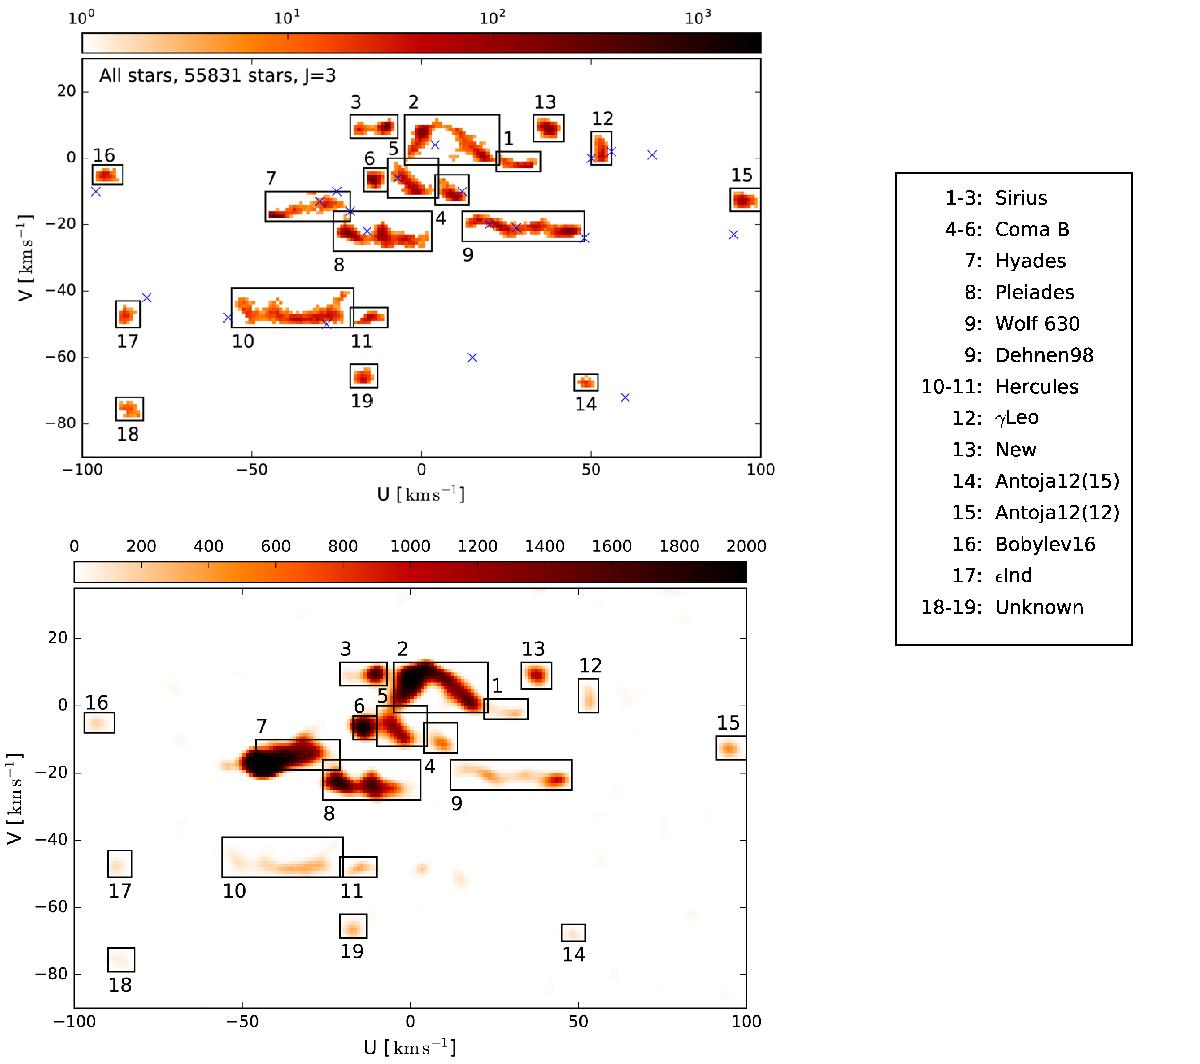
Top: positions of kinematic stellar structures obtained by wavelet transform applied for NMC = 2000 synthetic data samples for J = 3 in the U−V plane. Structure counts are shown with the orange colour. Black boxes embrace region of individual structures. Blue crosses show identification of structures in literature if any. Bottom: multi-resolution support count map for NMC = 2000 synthetic data samples for J = 3 in the U−V plane. Black boxes represent the same structures as in the top plot.
Current usage metrics show cumulative count of Article Views (full-text article views including HTML views, PDF and ePub downloads, according to the available data) and Abstracts Views on Vision4Press platform.
Data correspond to usage on the plateform after 2015. The current usage metrics is available 48-96 hours after online publication and is updated daily on week days.
Initial download of the metrics may take a while.