Fig. 2
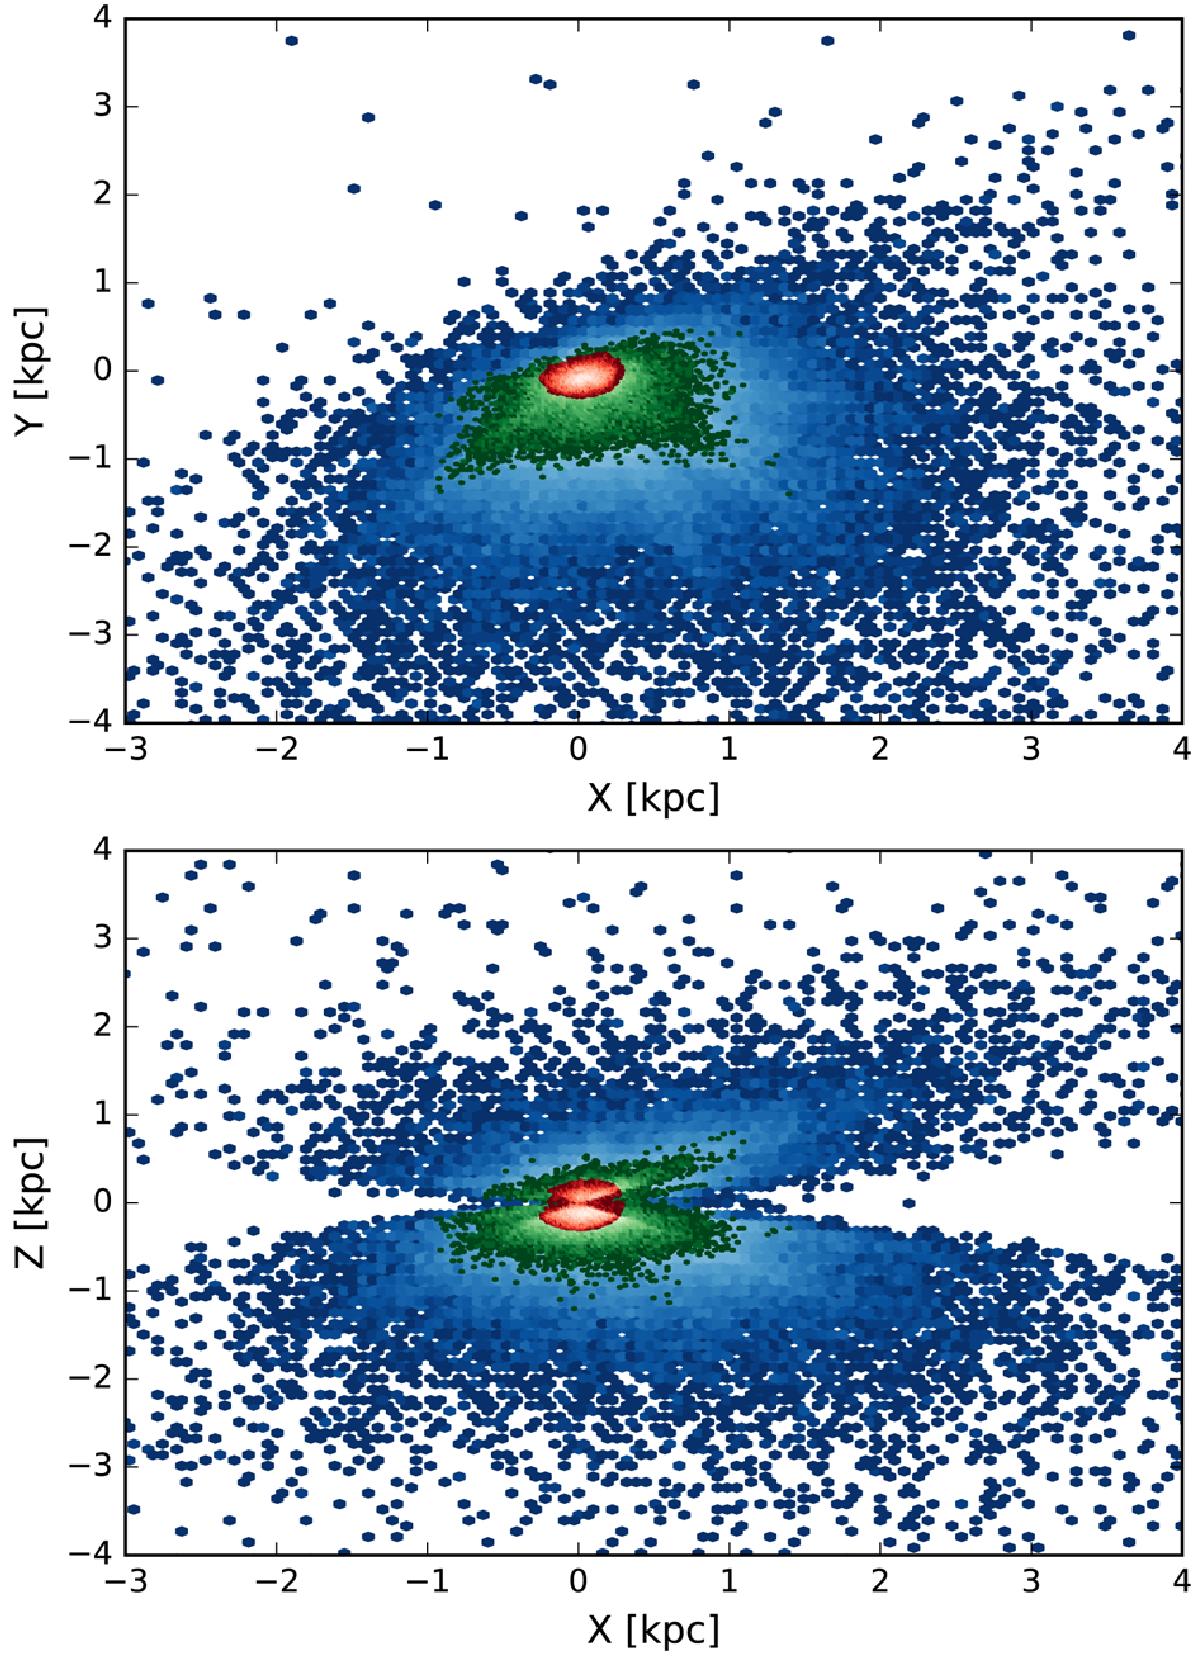
Spatial distribution of RAVE stars in the X−Y (top) and X−Z (bottom) planes shown as a log-scale density plot. Blue colour shows a sample of 159 299 stars, green colour is for a sample of 55 831 stars with σU and σV < 4 km s-1 and red colour describes the distribution of 31 533 stars associated with the solar neighbourhood (d < 300 pc). The lighter shades of each colour show higher numbers of stars in distributions.
Current usage metrics show cumulative count of Article Views (full-text article views including HTML views, PDF and ePub downloads, according to the available data) and Abstracts Views on Vision4Press platform.
Data correspond to usage on the plateform after 2015. The current usage metrics is available 48-96 hours after online publication and is updated daily on week days.
Initial download of the metrics may take a while.