Fig. 5
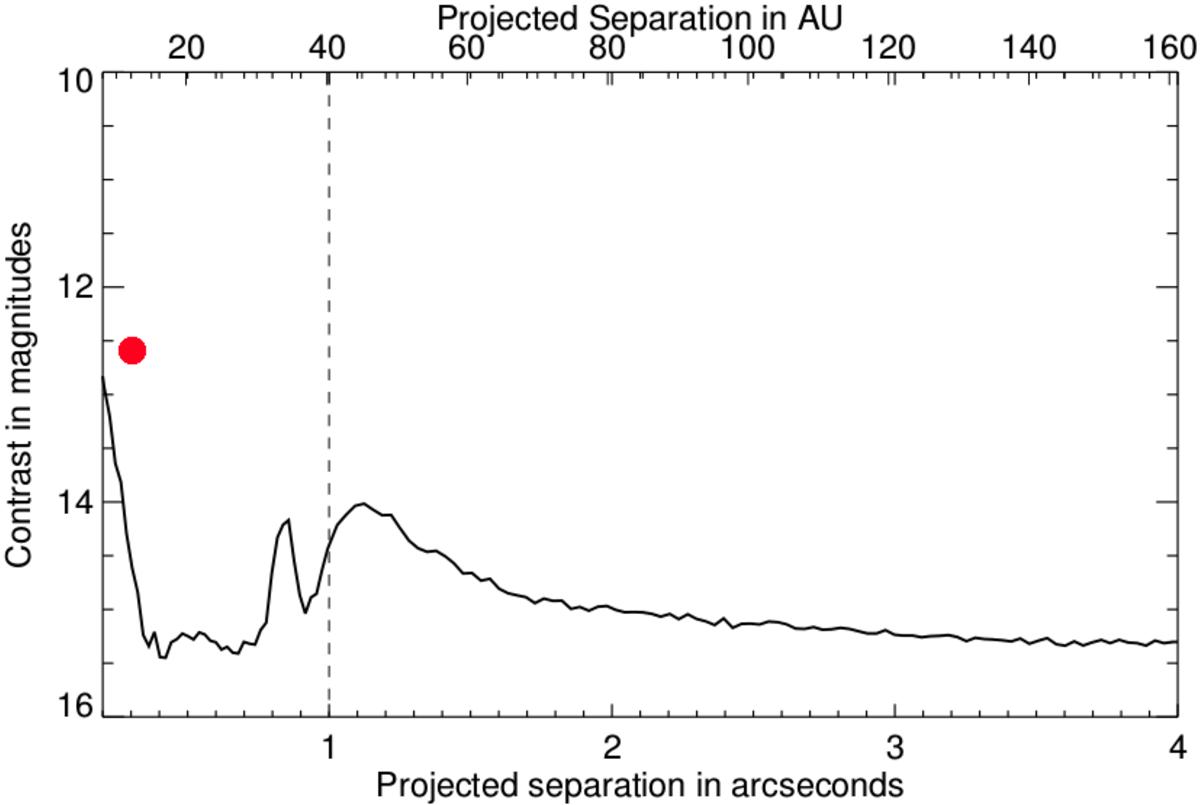
Five σ detection limits combining IFS and IRDIS information. Left of the dashed line, IFS sensitivity is best and we show IFS TLOCI-ASDI sensitivity using the mean of the channels covering Y, J, and H band. Right of the dashed line, we show IRDIS sensitivity after TLOCI-ADI reduction, using the mean of the K1 and K2 images. The red dot indicates HD 206893B.
Current usage metrics show cumulative count of Article Views (full-text article views including HTML views, PDF and ePub downloads, according to the available data) and Abstracts Views on Vision4Press platform.
Data correspond to usage on the plateform after 2015. The current usage metrics is available 48-96 hours after online publication and is updated daily on week days.
Initial download of the metrics may take a while.