Fig. 20
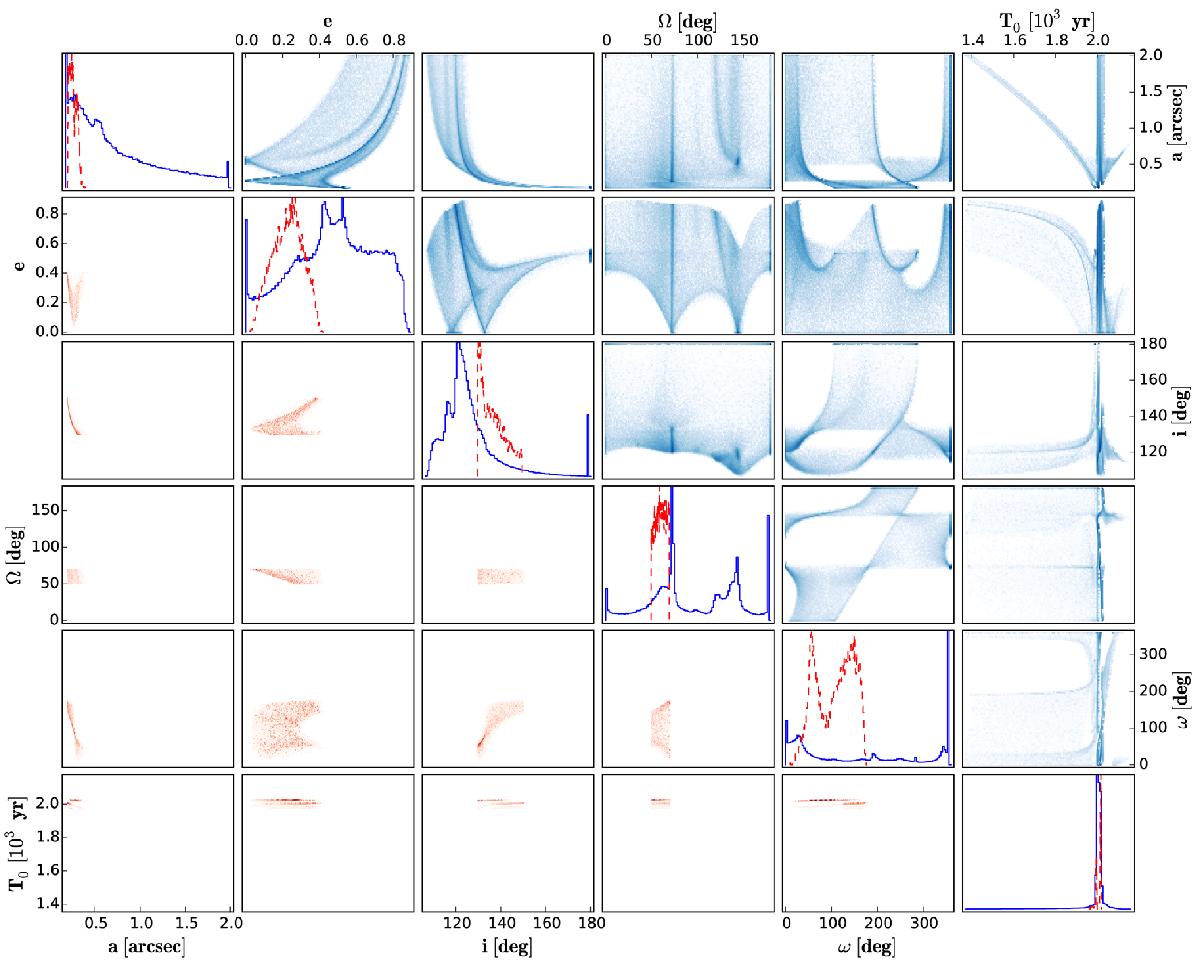
Results of our LSMC orbit fit for all fitting parameters. On the diagonal we show the distributions of each individual parameter (normalised to the distribution peak), while the other tiles show correlation plots between pairs of orbital parameters. In the upper right corner in blue hues (solid blue lines on the diagonal), we show all orbits that fit the available astrometry with an ![]() . In the lower left corner in red hues (red dashed lines on the diagonal), we show all the well fitting orbit solutions that are co-planar with the disk.
. In the lower left corner in red hues (red dashed lines on the diagonal), we show all the well fitting orbit solutions that are co-planar with the disk.
Current usage metrics show cumulative count of Article Views (full-text article views including HTML views, PDF and ePub downloads, according to the available data) and Abstracts Views on Vision4Press platform.
Data correspond to usage on the plateform after 2015. The current usage metrics is available 48-96 hours after online publication and is updated daily on week days.
Initial download of the metrics may take a while.