Free Access
Fig. 2
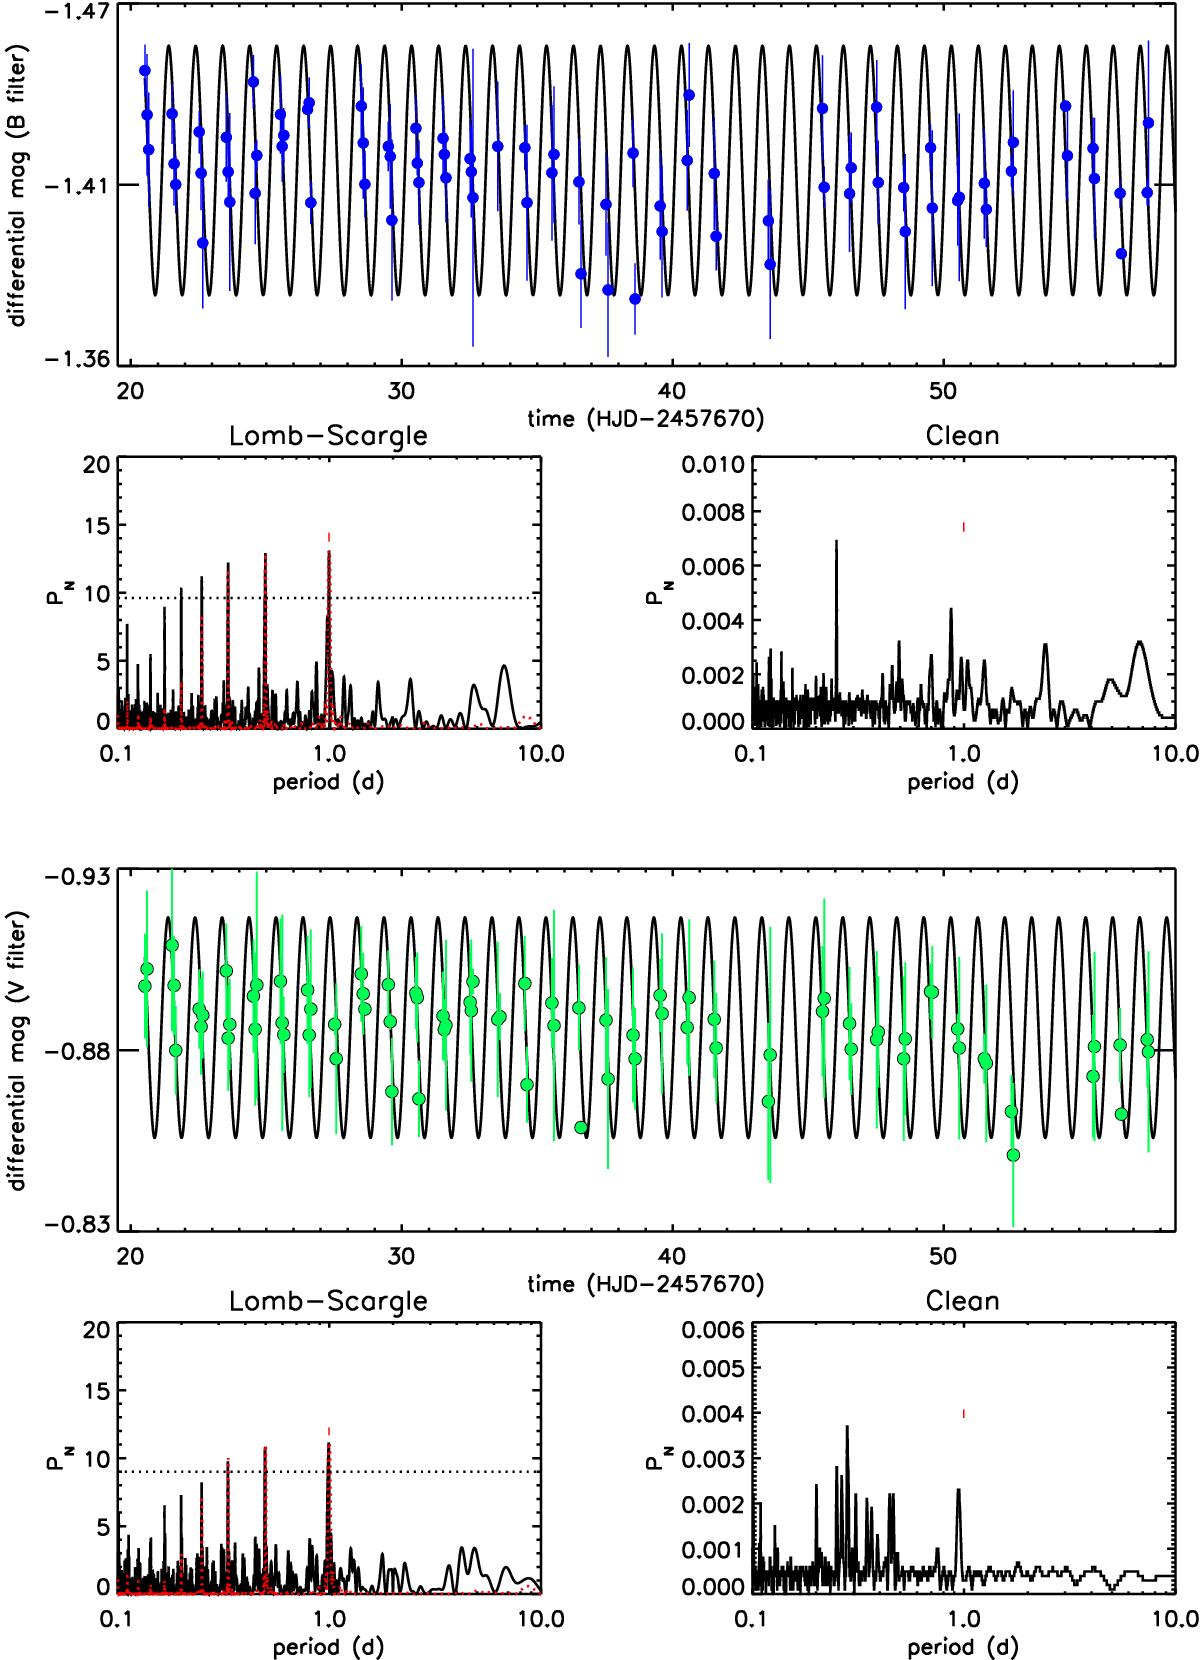
Results of photometric analysis of HD 206893 for B (top) and V filter (bottom) data. We plot the differential magnitude time series, the Lomb-Scargle periodogram (red line is the window function, dotted line the power at 99% confidence level), the Clean periodogram, and the light curve with the sinusoid fit overplotted.
This figure is made of several images, please see below:
Current usage metrics show cumulative count of Article Views (full-text article views including HTML views, PDF and ePub downloads, according to the available data) and Abstracts Views on Vision4Press platform.
Data correspond to usage on the plateform after 2015. The current usage metrics is available 48-96 hours after online publication and is updated daily on week days.
Initial download of the metrics may take a while.