Fig. 13
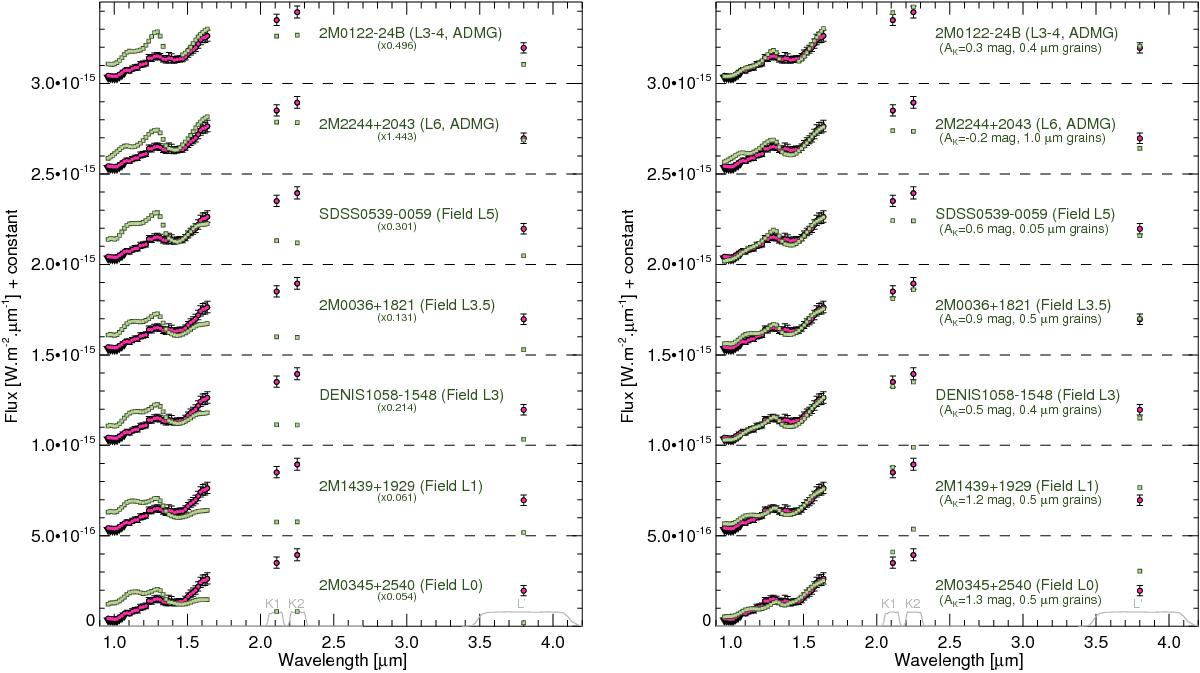
Comparison of spectral energy distribution of HD 206893b to those of flux-calibrated spectra of benchmark objects re-scaled to the distance of HD 206893b. On the left, the template spectra are re-normalised by an additional factor to match the flux of HD 206893. On the right, they are reddened by forsterite grains, but an additional normalisation factor is not applied.
Current usage metrics show cumulative count of Article Views (full-text article views including HTML views, PDF and ePub downloads, according to the available data) and Abstracts Views on Vision4Press platform.
Data correspond to usage on the plateform after 2015. The current usage metrics is available 48-96 hours after online publication and is updated daily on week days.
Initial download of the metrics may take a while.