Fig. 11
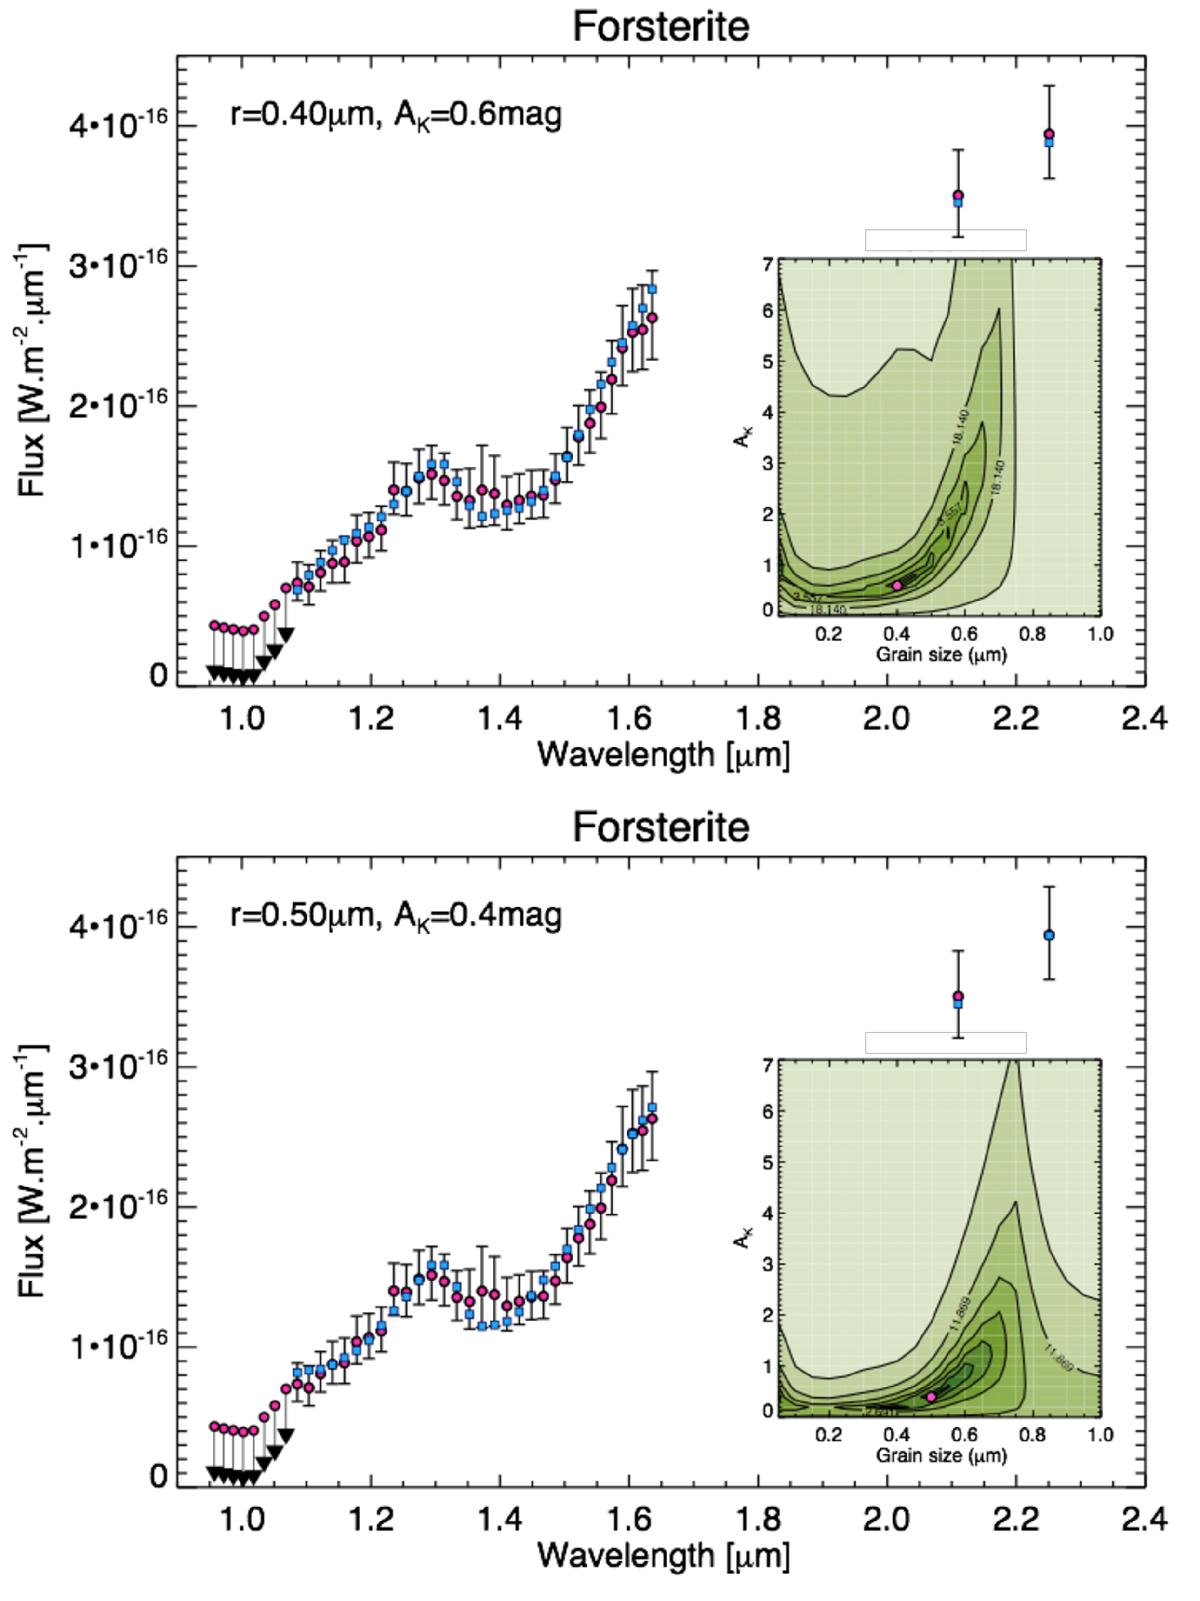
Comparison of the spectrum and photometry of HD 206893b (pink dots) to that of the L7 red dwarf PSO_J057.2893+15.2433 (bottom, Liu et al. 2013) and the L0 optical standard dwarf 2MASP J0345432+254023 (top, Kirkpatrick et al. 1997) reddened by a layer of forsterite grains with mean sizes of 0.50 and 0.40 μm, respectively. The mean flux of the reddened template spectrum is re-normalised to fit that of the companion. The G map is overlaid in the lower right portion of the plots.
Current usage metrics show cumulative count of Article Views (full-text article views including HTML views, PDF and ePub downloads, according to the available data) and Abstracts Views on Vision4Press platform.
Data correspond to usage on the plateform after 2015. The current usage metrics is available 48-96 hours after online publication and is updated daily on week days.
Initial download of the metrics may take a while.