Fig. 2
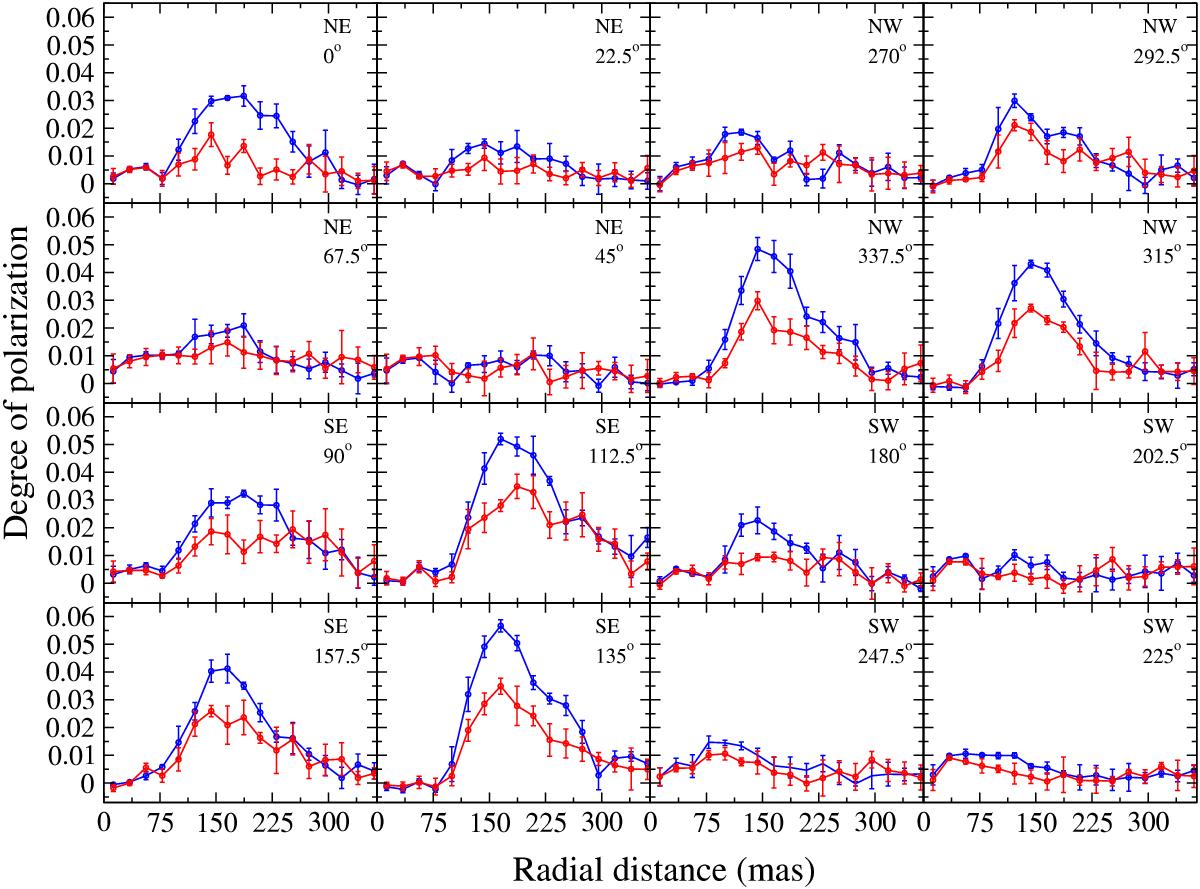
Radial profile of the linear degree of polarization for the continuum (blue) and Hα (red) filters for the NE (top left panels), NW (top right), SW (bottom right), and SE (bottom left) regions. The PAs are indicated in each panel, increasing clockwise in steps of 22.5°. Each data point is the average of six adjacent pixels along the corresponding PA vector, and the error bars are the corresponding standard deviations.
Current usage metrics show cumulative count of Article Views (full-text article views including HTML views, PDF and ePub downloads, according to the available data) and Abstracts Views on Vision4Press platform.
Data correspond to usage on the plateform after 2015. The current usage metrics is available 48-96 hours after online publication and is updated daily on week days.
Initial download of the metrics may take a while.