Free Access
Fig. 9
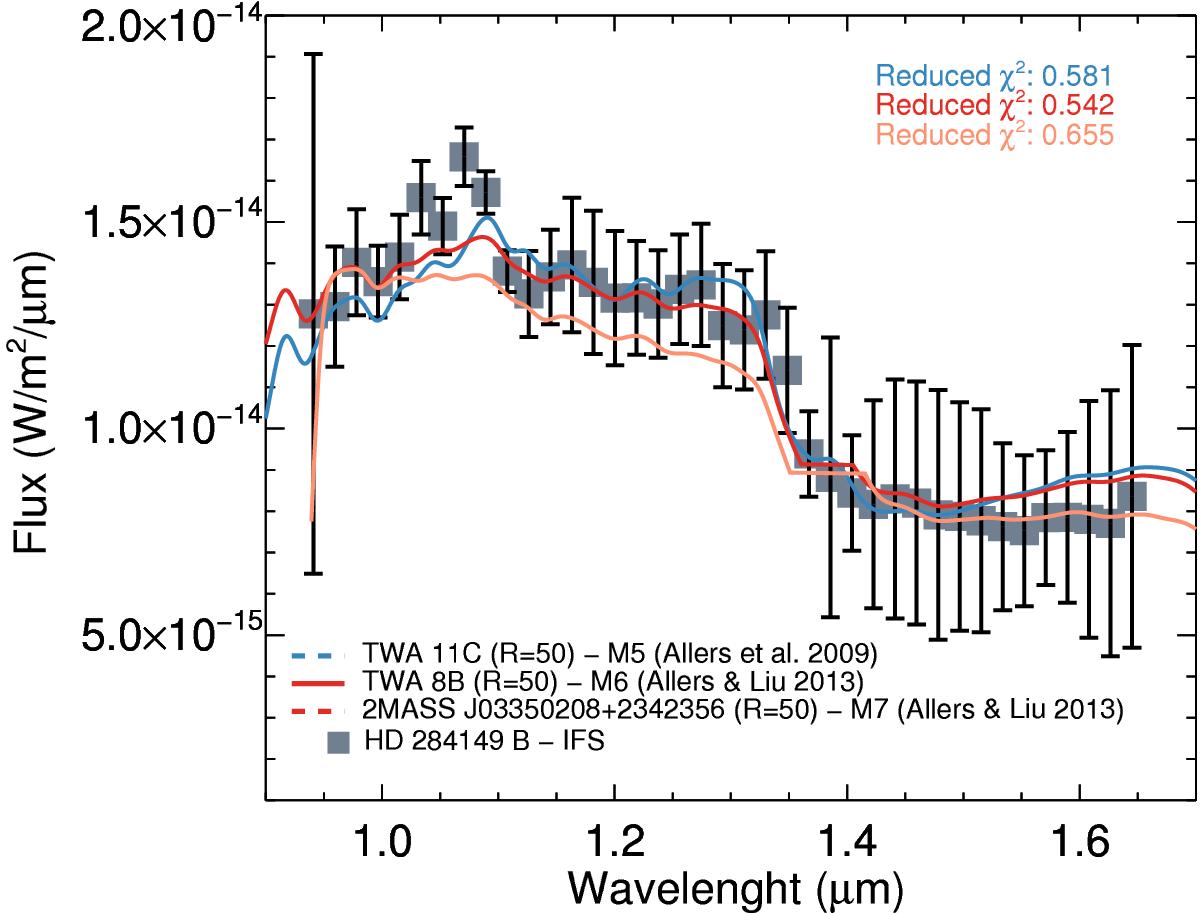
Comparison of the spectrum of HD 284149 B (grey squares) with the spectra of TWA8 B (Allers et al. 2009), TWA 11 C and 2MASS J03350208+2342356 (Allers & Liu 2013). The values of the reduced χ2 obtained for the fit are shown in the top right corner. TWA8 B (red curve) provides the best fit.
Current usage metrics show cumulative count of Article Views (full-text article views including HTML views, PDF and ePub downloads, according to the available data) and Abstracts Views on Vision4Press platform.
Data correspond to usage on the plateform after 2015. The current usage metrics is available 48-96 hours after online publication and is updated daily on week days.
Initial download of the metrics may take a while.