Fig. 2
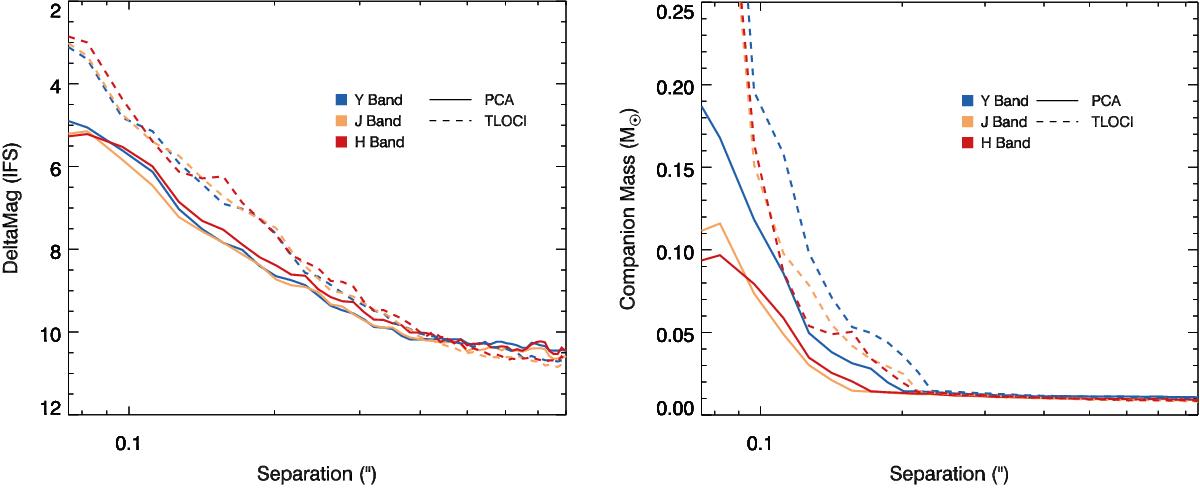
IFS detection limits achieved during the non-coronagraphic observations of HD 284149 in terms of Δmag (left panel) and minimum companion mass (right panel) vs. separation. The mass limits are evaluated using the COND models by Baraffe et al. (2003) and assuming an age of 35 Myr. The different colours show the limits for the Y, J and H IFS filters respectively. The dashed line shows the limits evaluated using the images processed using the TLOCI method for speckle suppression (Marois et al. 2014), while the solid lines show the ones obtained using the images reduced using the PCA algorithm (Soummer et al. 2012; Amara & Quanz 2012).
Current usage metrics show cumulative count of Article Views (full-text article views including HTML views, PDF and ePub downloads, according to the available data) and Abstracts Views on Vision4Press platform.
Data correspond to usage on the plateform after 2015. The current usage metrics is available 48-96 hours after online publication and is updated daily on week days.
Initial download of the metrics may take a while.