Fig. 6
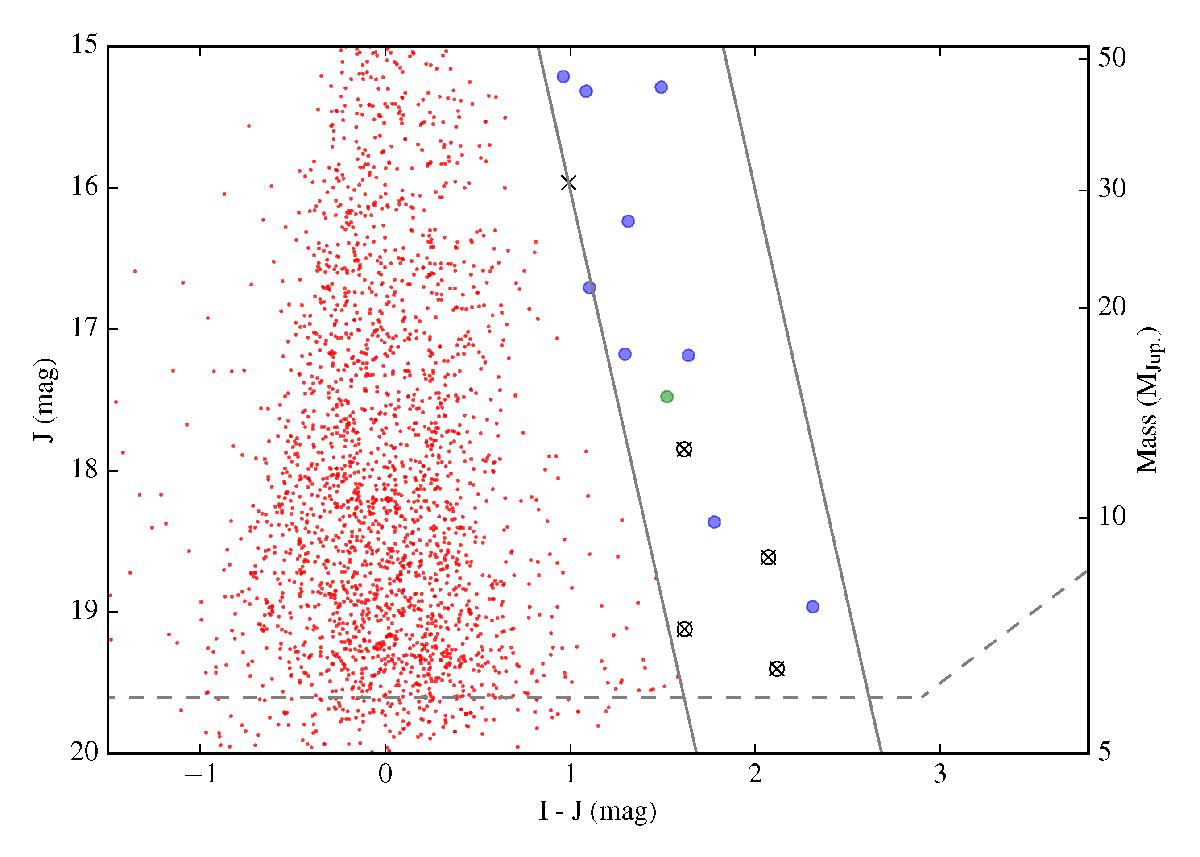
Colour–magnitude diagram based on UKIDSS J- and our I-band (including an offset of 31 mag) photometry. Markers are as follows, Red dots: the older field population, blue circles: young members from Peña Ramírez et al. (2012), green circles: candidate members from Peña Ramírez et al. (2012), crosses: sources initially identified as potential new members but with discrepant J−K values, crosses with circles: sources initially identified as potential new members but flagged as galaxies. The area between the two solid grey lines defines the photometric space of potential members. The dotted grey line is the approximate completeness limit.
Current usage metrics show cumulative count of Article Views (full-text article views including HTML views, PDF and ePub downloads, according to the available data) and Abstracts Views on Vision4Press platform.
Data correspond to usage on the plateform after 2015. The current usage metrics is available 48-96 hours after online publication and is updated daily on week days.
Initial download of the metrics may take a while.