Fig. 4
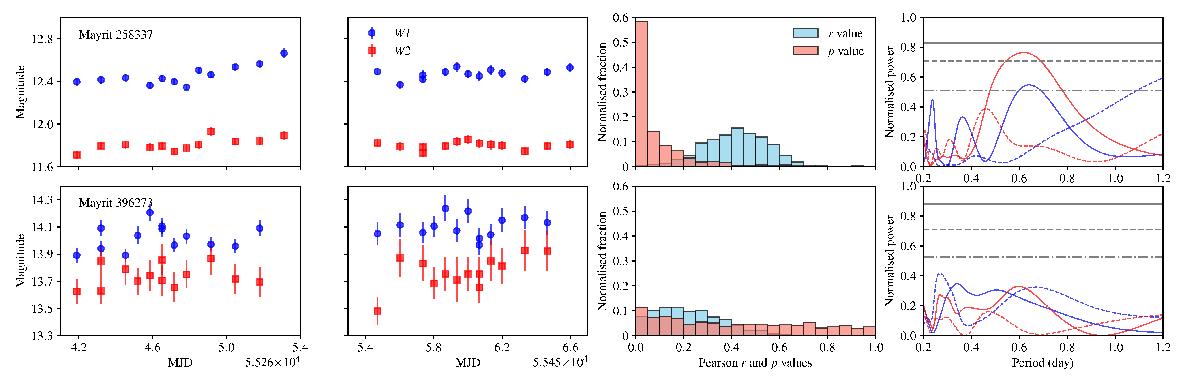
Left panels: photometry from the AllWISE Multiepoch Photometry Table for Mayrit 258337 (upper panels) and Mayrit 396273 (lower panels), separated by MJD range. The blue circles and red squares represent the photometric bands W1 and W2, respectively. First right panels: Pearson correlation coefficients (r) and their respective p values for 1000 simulations sets of WISE magnitudes. Second right panels: generalised Lomb-Scargle periodograms for each MJD versus WISE magnitude array. Colours are the same as in left panels. Dotted and solid lines present the first and second MJD range, respectively. The 1, 2, and 3σ intervals from 1000 bootstrap samples (for W2) are shown as the grey dot-dashed, dashed, and solid lines, respectively.
Current usage metrics show cumulative count of Article Views (full-text article views including HTML views, PDF and ePub downloads, according to the available data) and Abstracts Views on Vision4Press platform.
Data correspond to usage on the plateform after 2015. The current usage metrics is available 48-96 hours after online publication and is updated daily on week days.
Initial download of the metrics may take a while.