Free Access
Fig. 9
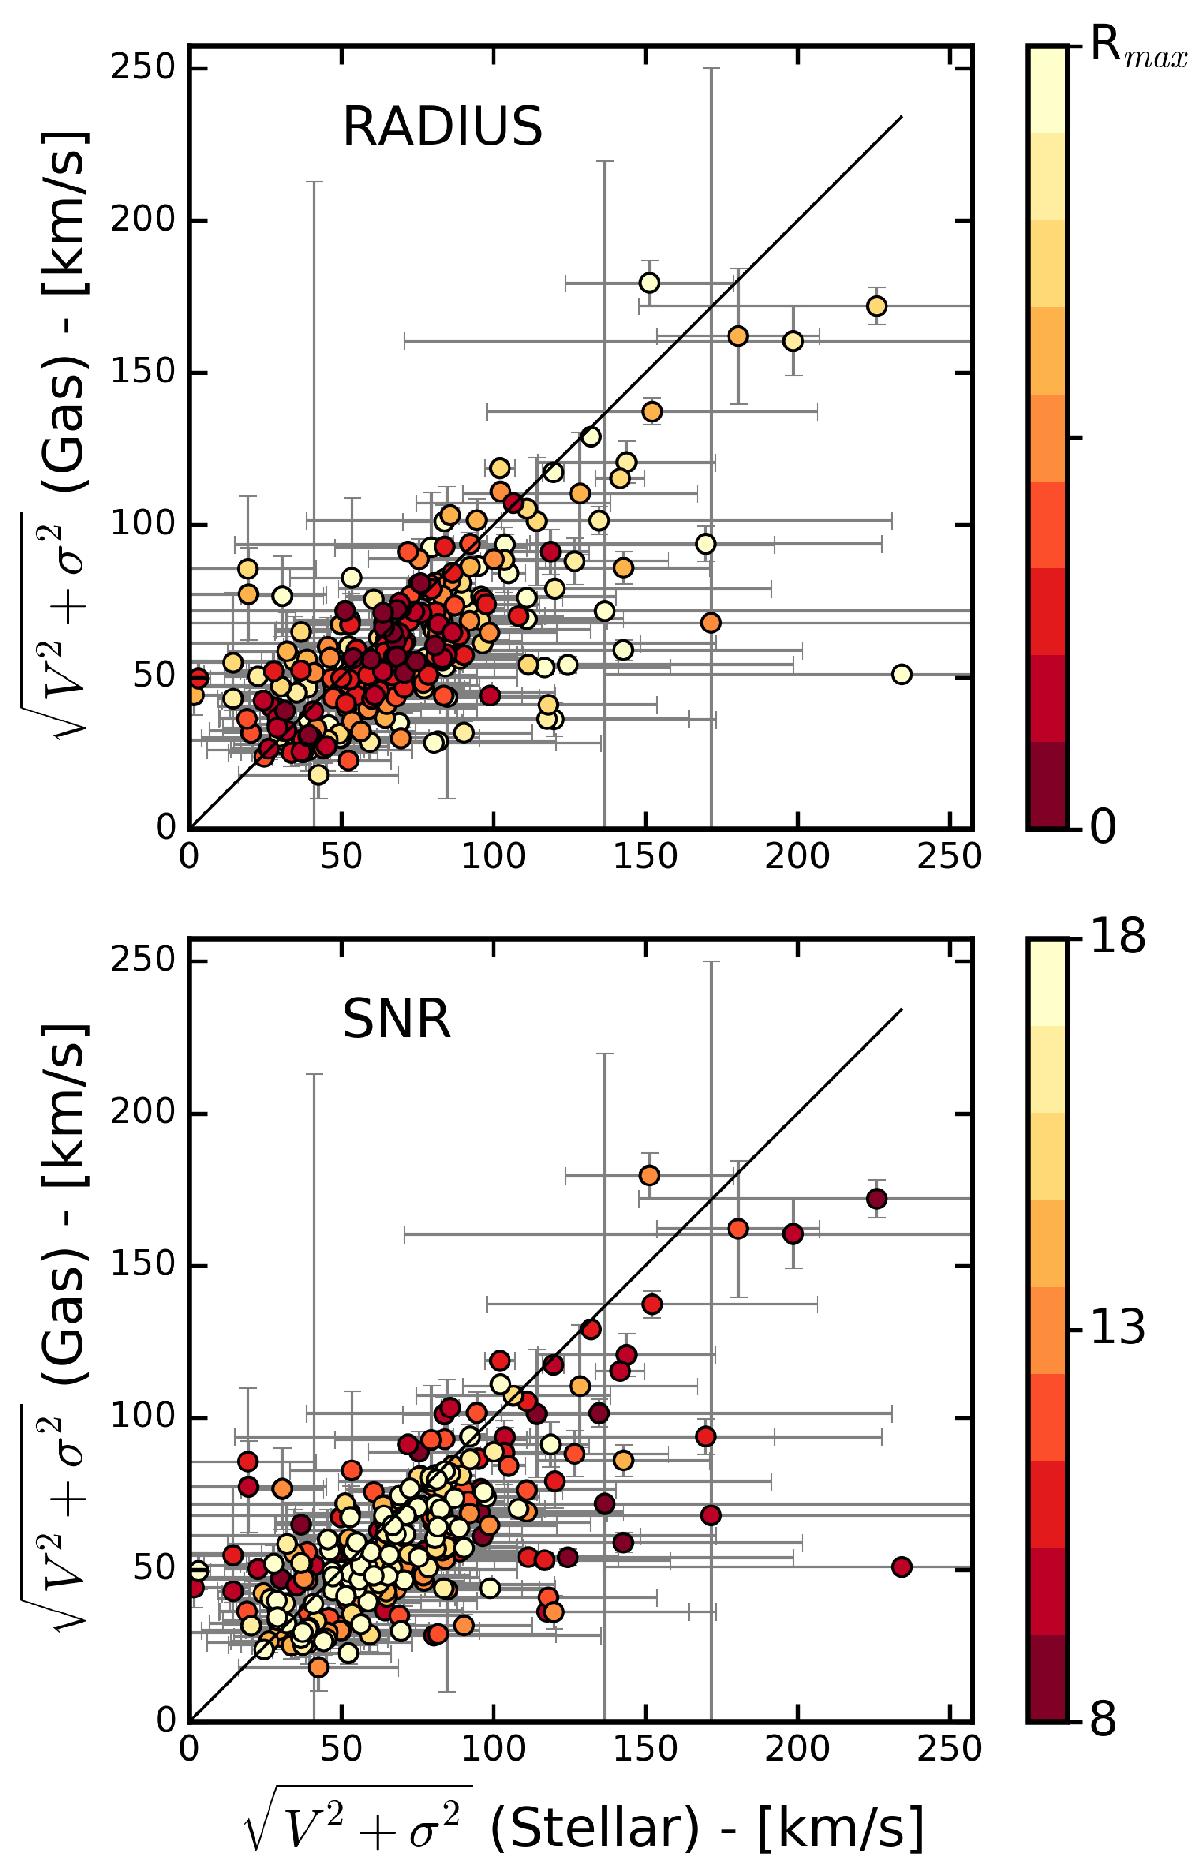
Second order velocity moment of the stellar and gas components, ![]() , for all the galaxies of the sample. Each point corresponds to a spatial bin of MUSE sub-cubes and is colour coded by its respective radial distance (top panel) and its respective S/N bin (bottom panel). The 1:1 relation is indicated by the black lines.
, for all the galaxies of the sample. Each point corresponds to a spatial bin of MUSE sub-cubes and is colour coded by its respective radial distance (top panel) and its respective S/N bin (bottom panel). The 1:1 relation is indicated by the black lines.
Current usage metrics show cumulative count of Article Views (full-text article views including HTML views, PDF and ePub downloads, according to the available data) and Abstracts Views on Vision4Press platform.
Data correspond to usage on the plateform after 2015. The current usage metrics is available 48-96 hours after online publication and is updated daily on week days.
Initial download of the metrics may take a while.