Fig. 8
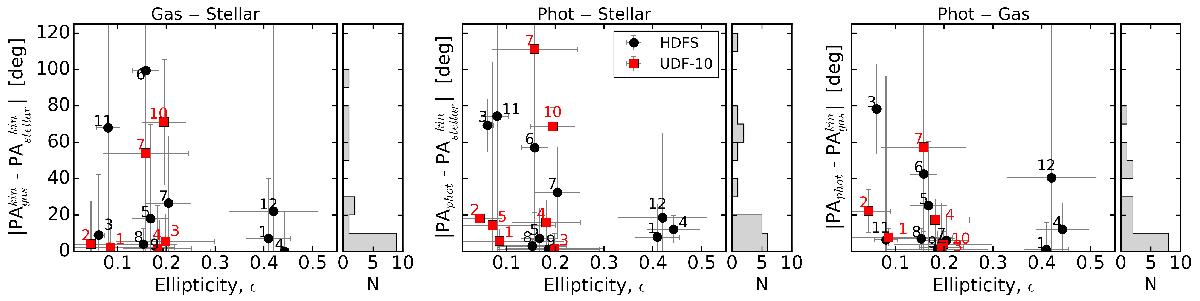
Comparison of the gas and stellar kinematics major-axis PA (left panel), the photometric major-axis PA (PAphot) and the stellar kinematics PA![]() (middle panel), and the PAphot with the gas kinematics PA
(middle panel), and the PAphot with the gas kinematics PA![]() (right panel). The distributions of the kinematics misalignment angles (KMA) are shown on the right side of each plot. Despite the large uncertainties, we find a global alignment of the morphological, stellar, and gas kinematics major-axis PAs. The galaxy ID numbers are indicated above each point.
(right panel). The distributions of the kinematics misalignment angles (KMA) are shown on the right side of each plot. Despite the large uncertainties, we find a global alignment of the morphological, stellar, and gas kinematics major-axis PAs. The galaxy ID numbers are indicated above each point.
Current usage metrics show cumulative count of Article Views (full-text article views including HTML views, PDF and ePub downloads, according to the available data) and Abstracts Views on Vision4Press platform.
Data correspond to usage on the plateform after 2015. The current usage metrics is available 48-96 hours after online publication and is updated daily on week days.
Initial download of the metrics may take a while.