Fig. 7
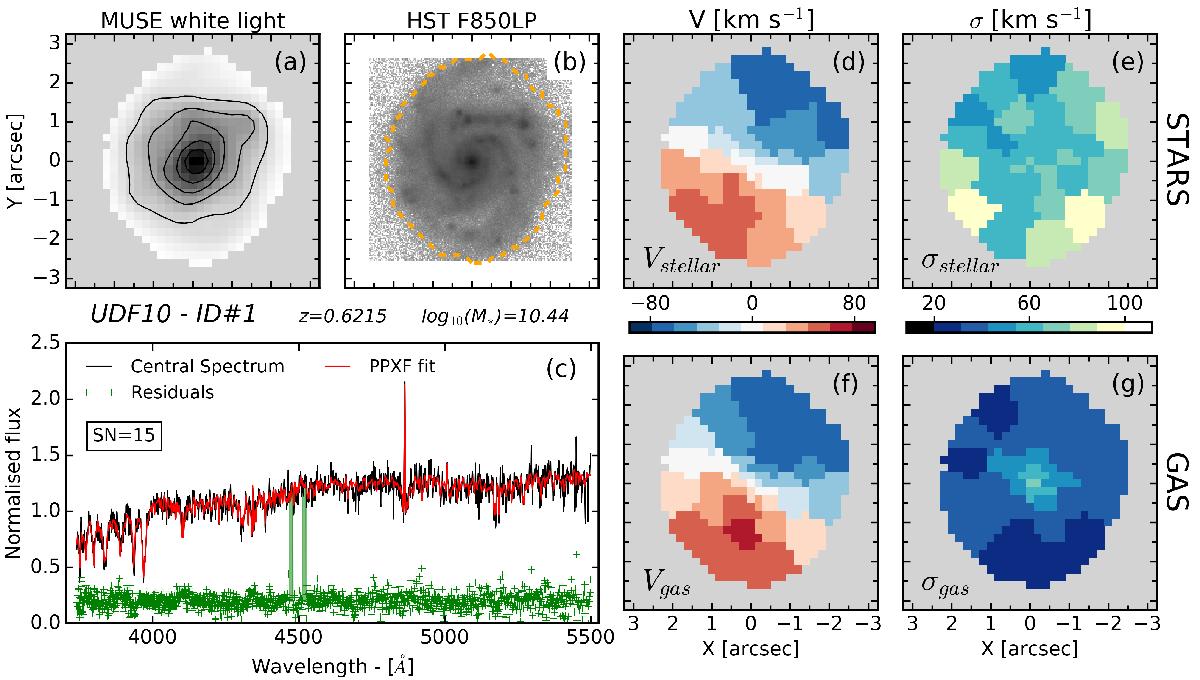
Kinematics analysis of the UDF10-ID #1 galaxy. Panel a: MUSE white light image of the galaxy. Isophote contours are overplotted with black continuous lines. Panel b: HST F850LP image with the spatial coverage of the MUSE data cube (satisfying our spectral S/N rejection criterion) is indicated by the orange dashed contour. Panel c: fit of the central spectrum of the spatially binned sub-cube (black solid line) and its best fit from pPXF (red continuous line) is shown. The green points represent the fit residuals that are arbitrarily shifted along the vertical axis. The green shaded areas correspond to the masked regions (i.e. sky line residuals). Panels d–e: resolved stellar kinematics, respectively: the LOS velocity Vstellar (panel d) and the velocity dispersion σstellar (panel e) are shown. The scales of the colour scheme are indicated by the colour bars at the bottom of each panel. Panels f–g: resolved gas kinematics from the Balmer series of emission lines, respectively: the rotational velocity Vgas (panel f) and the velocity dispersion σgas (panel g) are shown. The scales of the colour scheme are indicated by the colour bars on top of each panel. The galaxy ID number, its redshift, and stellar mass are indicated above panel c.
Current usage metrics show cumulative count of Article Views (full-text article views including HTML views, PDF and ePub downloads, according to the available data) and Abstracts Views on Vision4Press platform.
Data correspond to usage on the plateform after 2015. The current usage metrics is available 48-96 hours after online publication and is updated daily on week days.
Initial download of the metrics may take a while.