Fig. 5
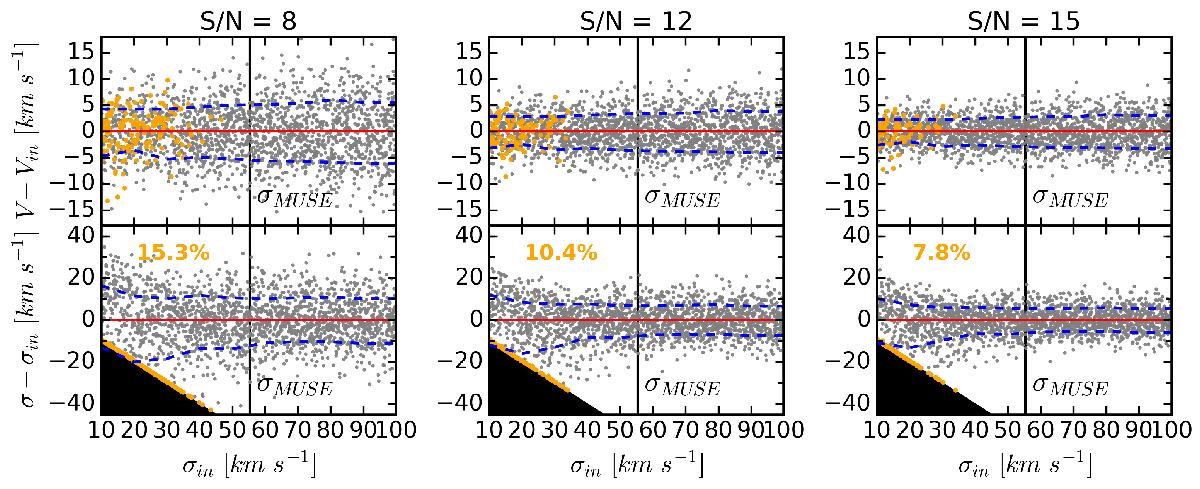
Monte Carlo simulations of the fitting procedure of the MUSE spectra for three different S/Ns in the stellar continuum, i.e. S/N = 8 (left panels), S/N = 12 (middle panels), and S/N = 15 (right panels), representative of the targeted S/N of the spatially binned MUSE observations. We used a stellar template from the Indo-US library (Valdes et al. 2004) that we matched to the MUSE spectral characteristics (i.e. wavelength range, spectral resolution, and spectral sampling), and fitted with pPXF using the same procedure as used for the MUSE observations. The top panels show the recovered radial velocity V, and the bottom panels the measured velocity dispersion σ, as a function of the input velocity dispersion σin of the stellar template. The grey points represent 2000 realisations, the blue dashed lines the 1σ deviation from the mean value in bins of 10 km s-1, and the black areas represent non-physical solutions. No systematic biases are observed for V at any σin level or for σ above σin ≈ 40 km s-1. Catastrophic failure events (orange dots) are observed for about 7–15% of the cases below σin ≈ 40 km s-1. Systematic errors of ≈5 km s-1 for V, and ≈10 km s-1 for σ are observed.
Current usage metrics show cumulative count of Article Views (full-text article views including HTML views, PDF and ePub downloads, according to the available data) and Abstracts Views on Vision4Press platform.
Data correspond to usage on the plateform after 2015. The current usage metrics is available 48-96 hours after online publication and is updated daily on week days.
Initial download of the metrics may take a while.