Fig. 4
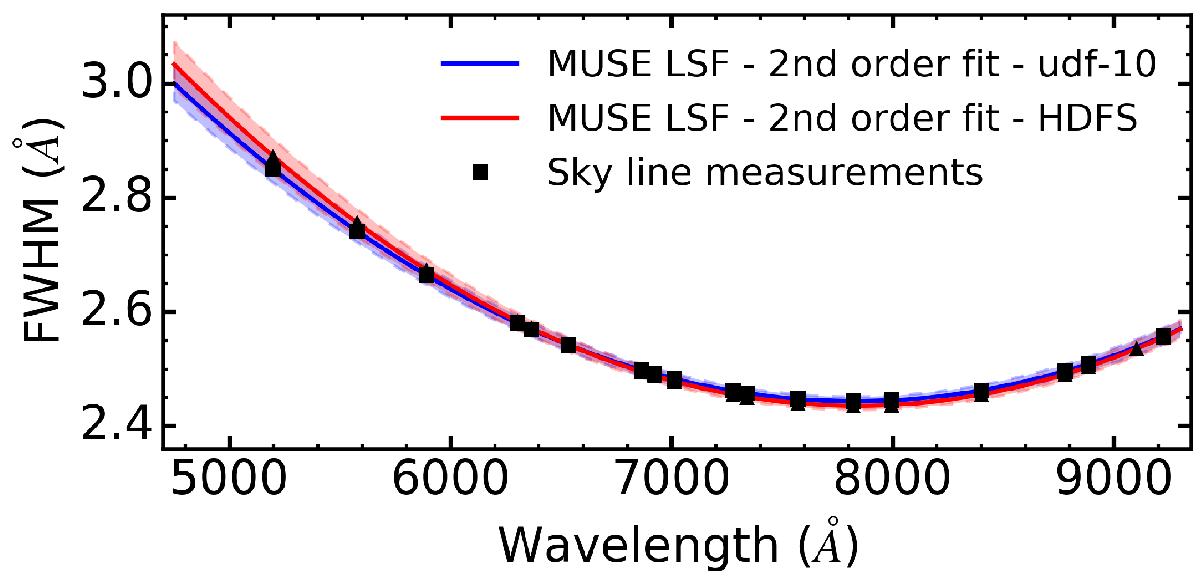
MUSE line spread functions (LSF) measured in the non sky-subtracted HDFS and udf-10 MUSE data cubes. The LSF spatial mean FWHM (i.e. averaged over the data cube FoV) are indicated by the solid lines, and their 1σ spatial variation by the respective shaded areas. The latter corresponds to a typical error in the derived velocity dispersion of σ ≲ 1 km s-1. The black squares (udf-10) and triangles (HDFS) indicate the positions of the sky line measurements.
Current usage metrics show cumulative count of Article Views (full-text article views including HTML views, PDF and ePub downloads, according to the available data) and Abstracts Views on Vision4Press platform.
Data correspond to usage on the plateform after 2015. The current usage metrics is available 48-96 hours after online publication and is updated daily on week days.
Initial download of the metrics may take a while.