Fig. 3
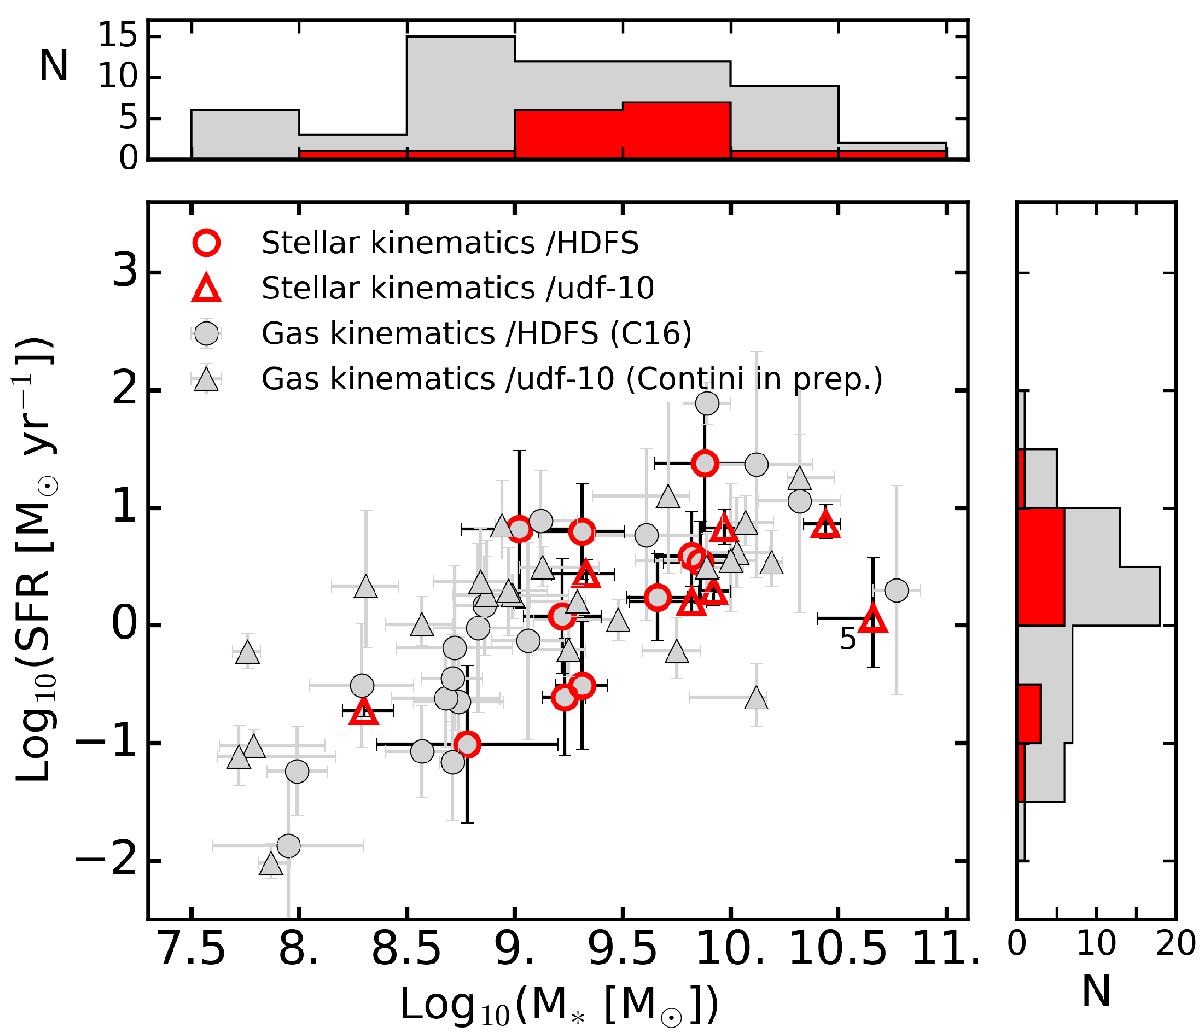
Distribution of the SFR as a function of the stellar mass for the sample of spatially resolved continuum galaxies (red markers). Galaxies suitable for the analysis of spatially resolved gas kinematics (C16; Contini et al., and in prep.) are indicated by the grey symbols. The sample galaxies fall along the “normal” star-forming sequence of galaxies and extend to the lowest stellar mass regime (~108.5 M⊙) probed so far with IFS surveys. UDF10-ID #5, indicated by its ID number, shows no ionised gas in the MUSE data cube (except a weak [OII] line) and deviates from the “normal” star-forming sequence.
Current usage metrics show cumulative count of Article Views (full-text article views including HTML views, PDF and ePub downloads, according to the available data) and Abstracts Views on Vision4Press platform.
Data correspond to usage on the plateform after 2015. The current usage metrics is available 48-96 hours after online publication and is updated daily on week days.
Initial download of the metrics may take a while.