Fig. B.1
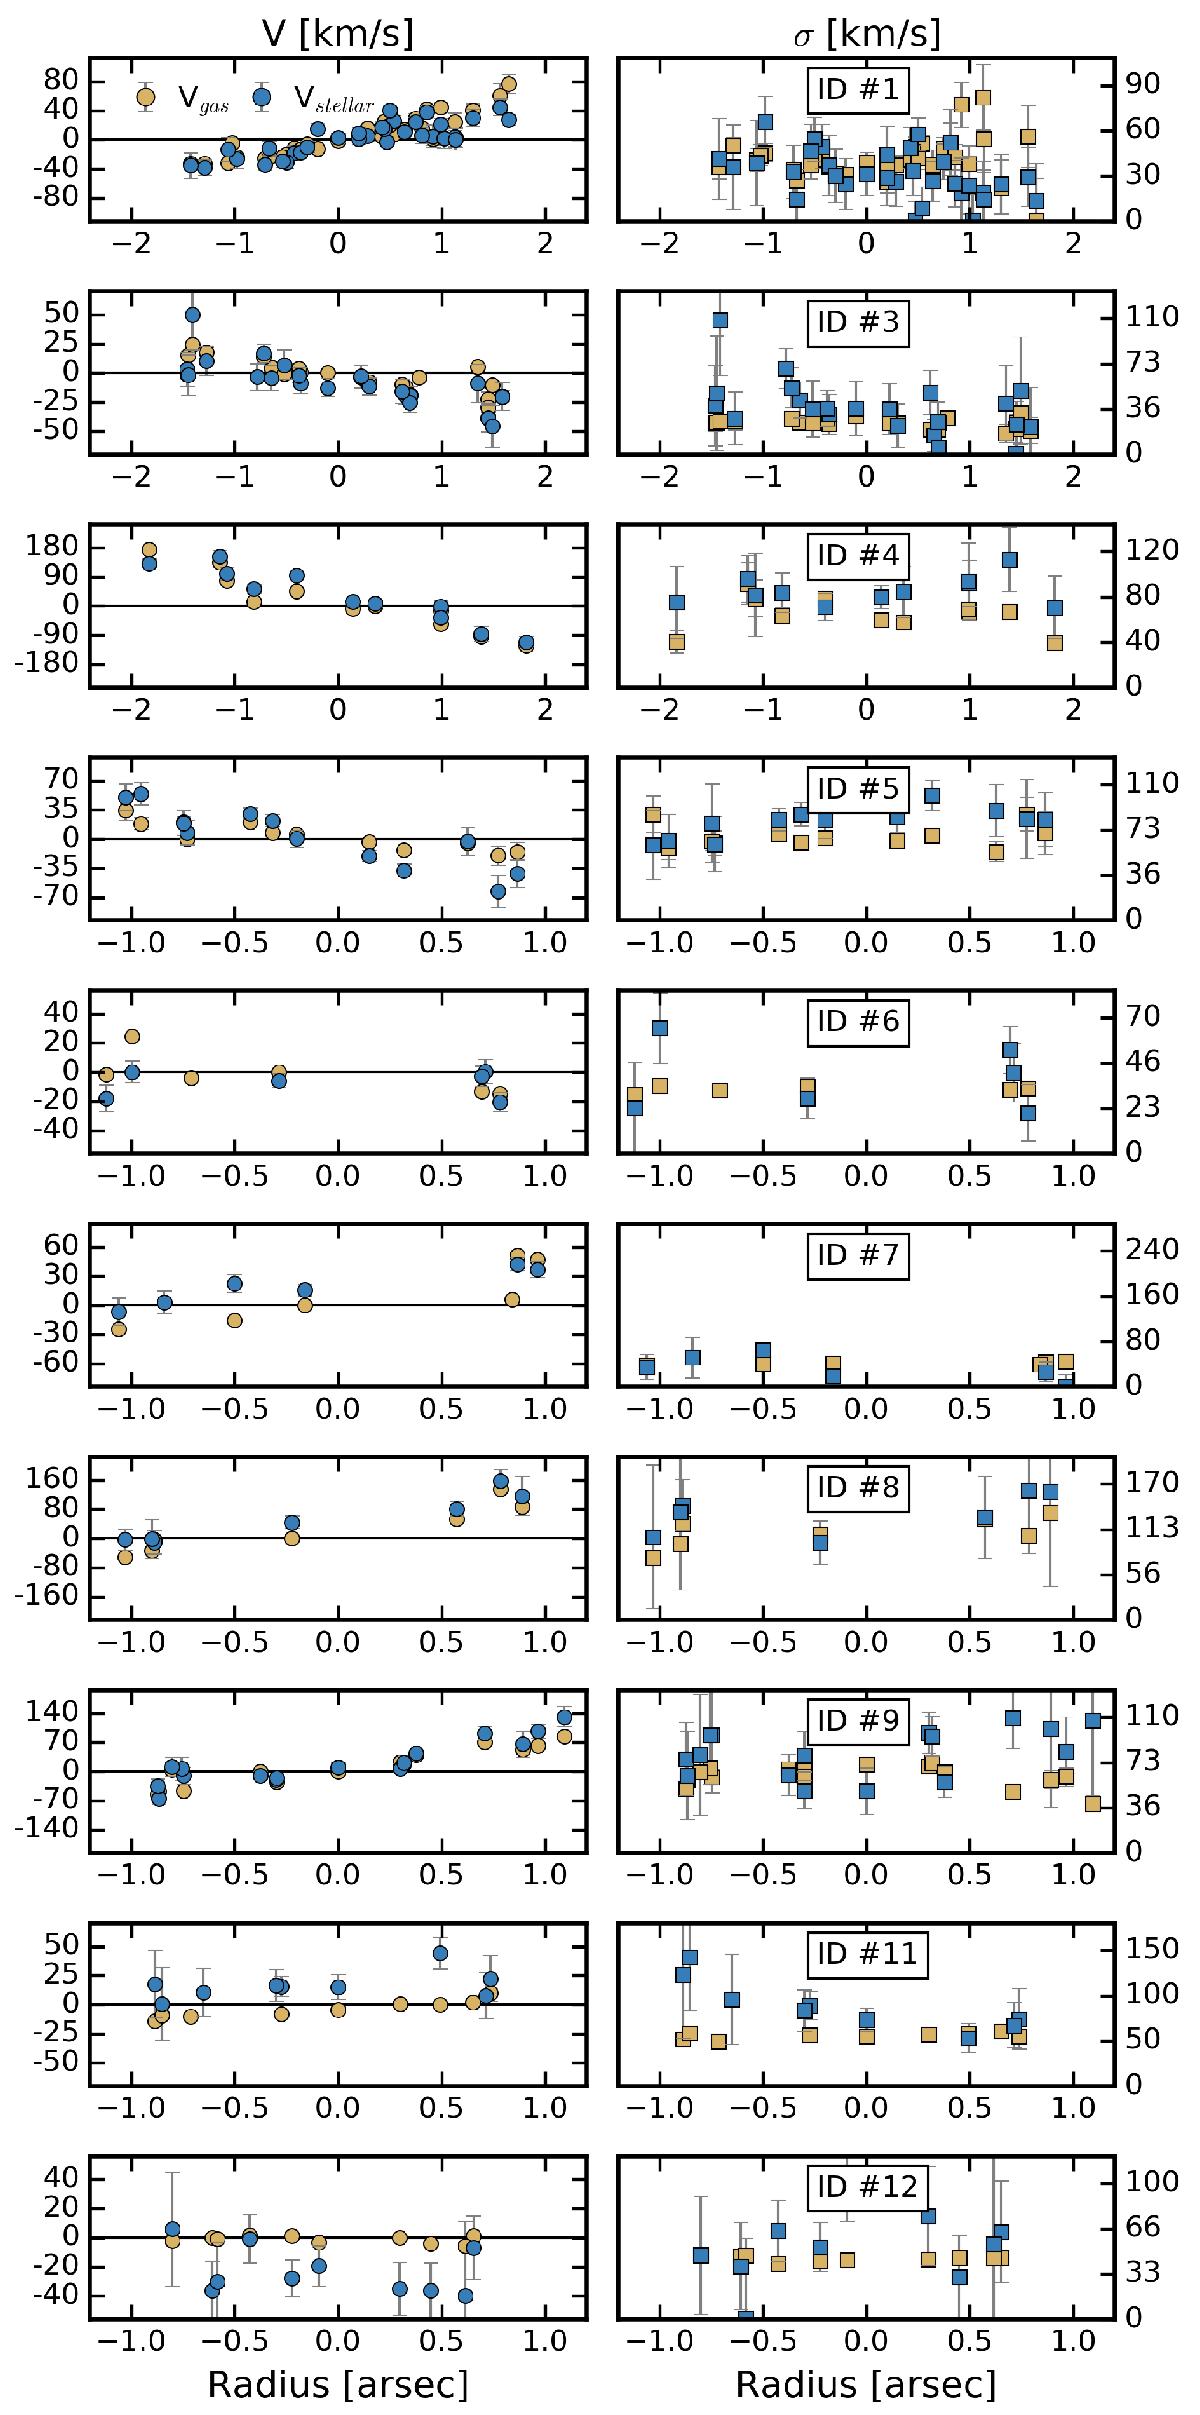
One-dimensional version of the kinematic maps for the HDFS galaxies. Each line corresponds to one galaxy, indicated by the ID number on the right panel. The left column shows the LOS velocity, V, and the right column shows the LOS velocity dispersion, σ. Each point corresponds to a spatial bin of the MUSE sub-cubes and the radius is the distance from the center (i.e. not interpolated either cut along the major axis). Blue points are for the stellar component and orange points are for the gas.
Current usage metrics show cumulative count of Article Views (full-text article views including HTML views, PDF and ePub downloads, according to the available data) and Abstracts Views on Vision4Press platform.
Data correspond to usage on the plateform after 2015. The current usage metrics is available 48-96 hours after online publication and is updated daily on week days.
Initial download of the metrics may take a while.