Fig. 2
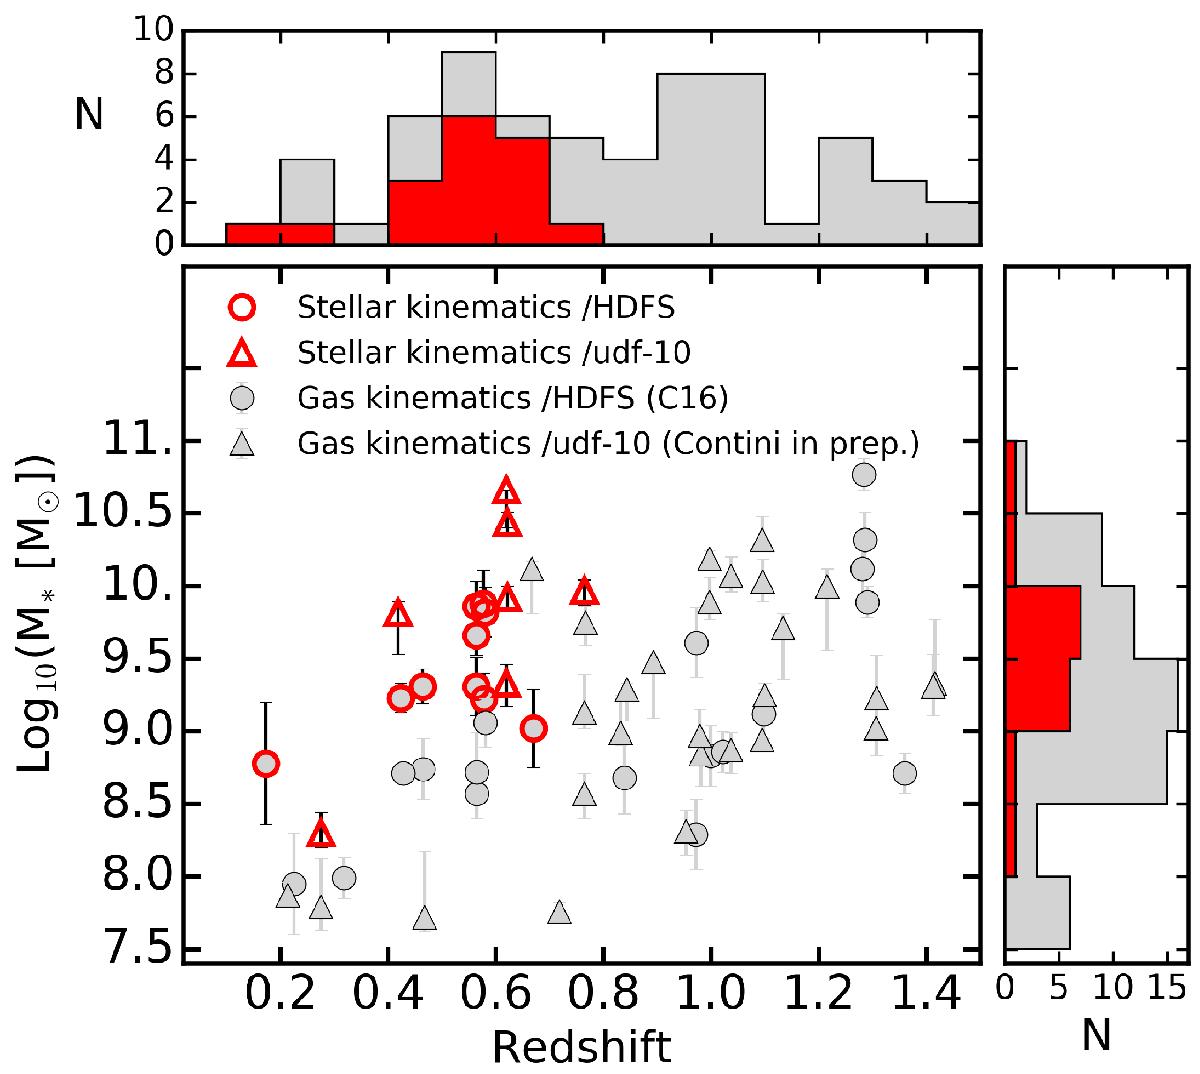
Distribution of stellar mass as a function of redshift for the sample of spatially resolved continuum galaxies (red markers). Galaxies suitable for the analysis of spatially resolved gas kinematics (C16; Contini et al., and in prep.) are indicated by the grey symbols. Above redshift z = 0.8, no galaxies are spatially resolved in their continuum owing to the natural decrease of the apparent magnitude with redshift and significant OH sky line contamination in the MUSE wavelength range at these redshifts.
Current usage metrics show cumulative count of Article Views (full-text article views including HTML views, PDF and ePub downloads, according to the available data) and Abstracts Views on Vision4Press platform.
Data correspond to usage on the plateform after 2015. The current usage metrics is available 48-96 hours after online publication and is updated daily on week days.
Initial download of the metrics may take a while.