Free Access
Fig. 8
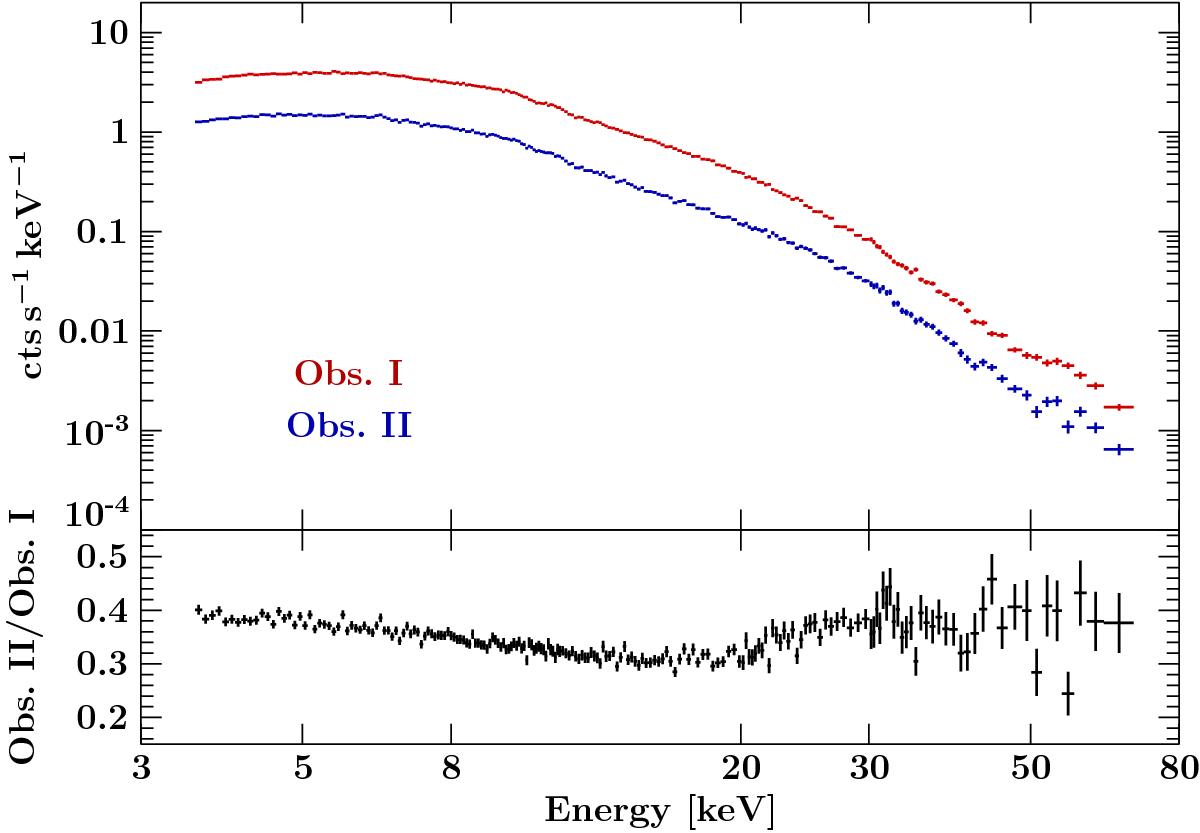
Top: count rate spectra of NuSTAR-FPMA of Obs. I (red) and Obs. II (blue). Bottom: ratio of the count rate spectra. For clarity we binned the spectra using larger bins for the plot than those used for the fit.
Current usage metrics show cumulative count of Article Views (full-text article views including HTML views, PDF and ePub downloads, according to the available data) and Abstracts Views on Vision4Press platform.
Data correspond to usage on the plateform after 2015. The current usage metrics is available 48-96 hours after online publication and is updated daily on week days.
Initial download of the metrics may take a while.