Fig. 4
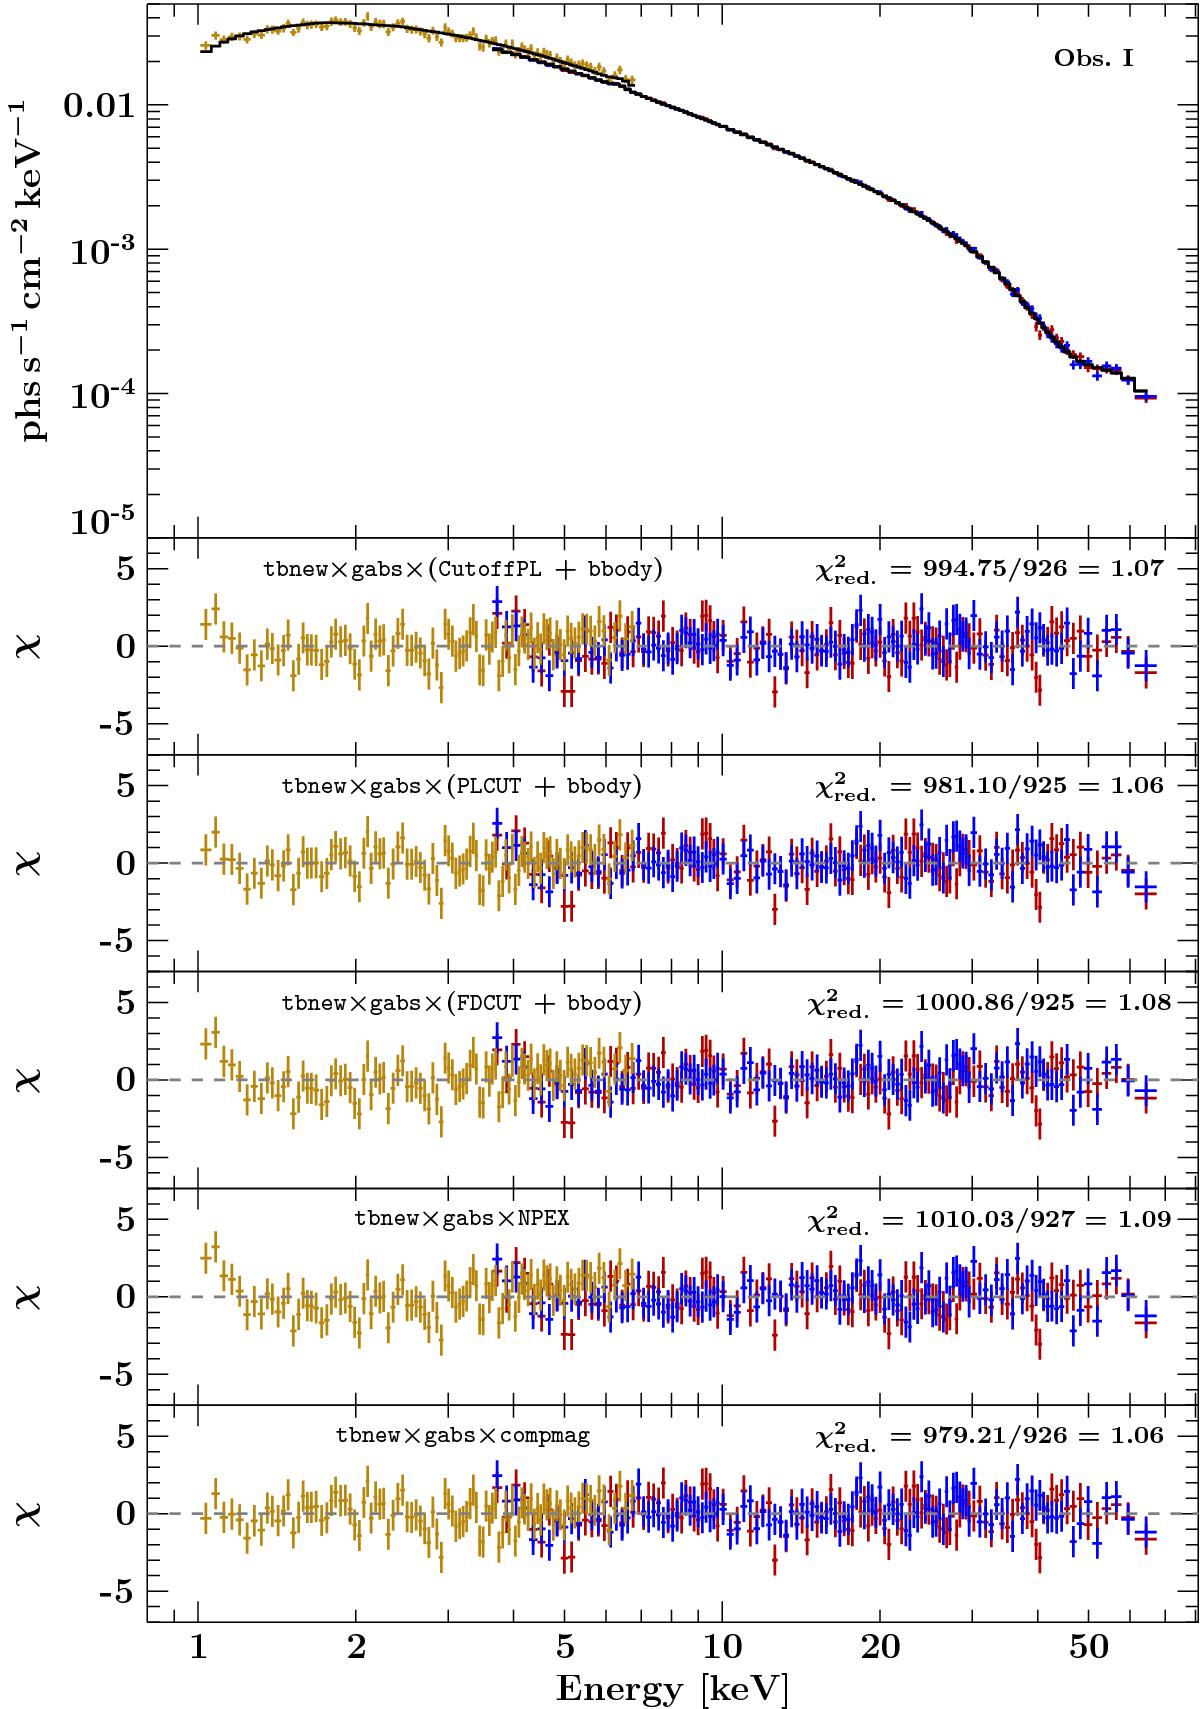
Top panel: unfolded phase-averaged spectrum of Obs. I with best-fit model: XRT (gold), FPMA (blue), FPMB (red), and model for the CutoffPL model (black). All models include an additional narrow iron line. Lower panels: residuals to the different continuum models. For clarity we binned the spectra using larger bins for the plot than the ones used for the fit.
Current usage metrics show cumulative count of Article Views (full-text article views including HTML views, PDF and ePub downloads, according to the available data) and Abstracts Views on Vision4Press platform.
Data correspond to usage on the plateform after 2015. The current usage metrics is available 48-96 hours after online publication and is updated daily on week days.
Initial download of the metrics may take a while.