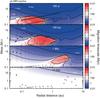
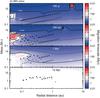
Fig. 5
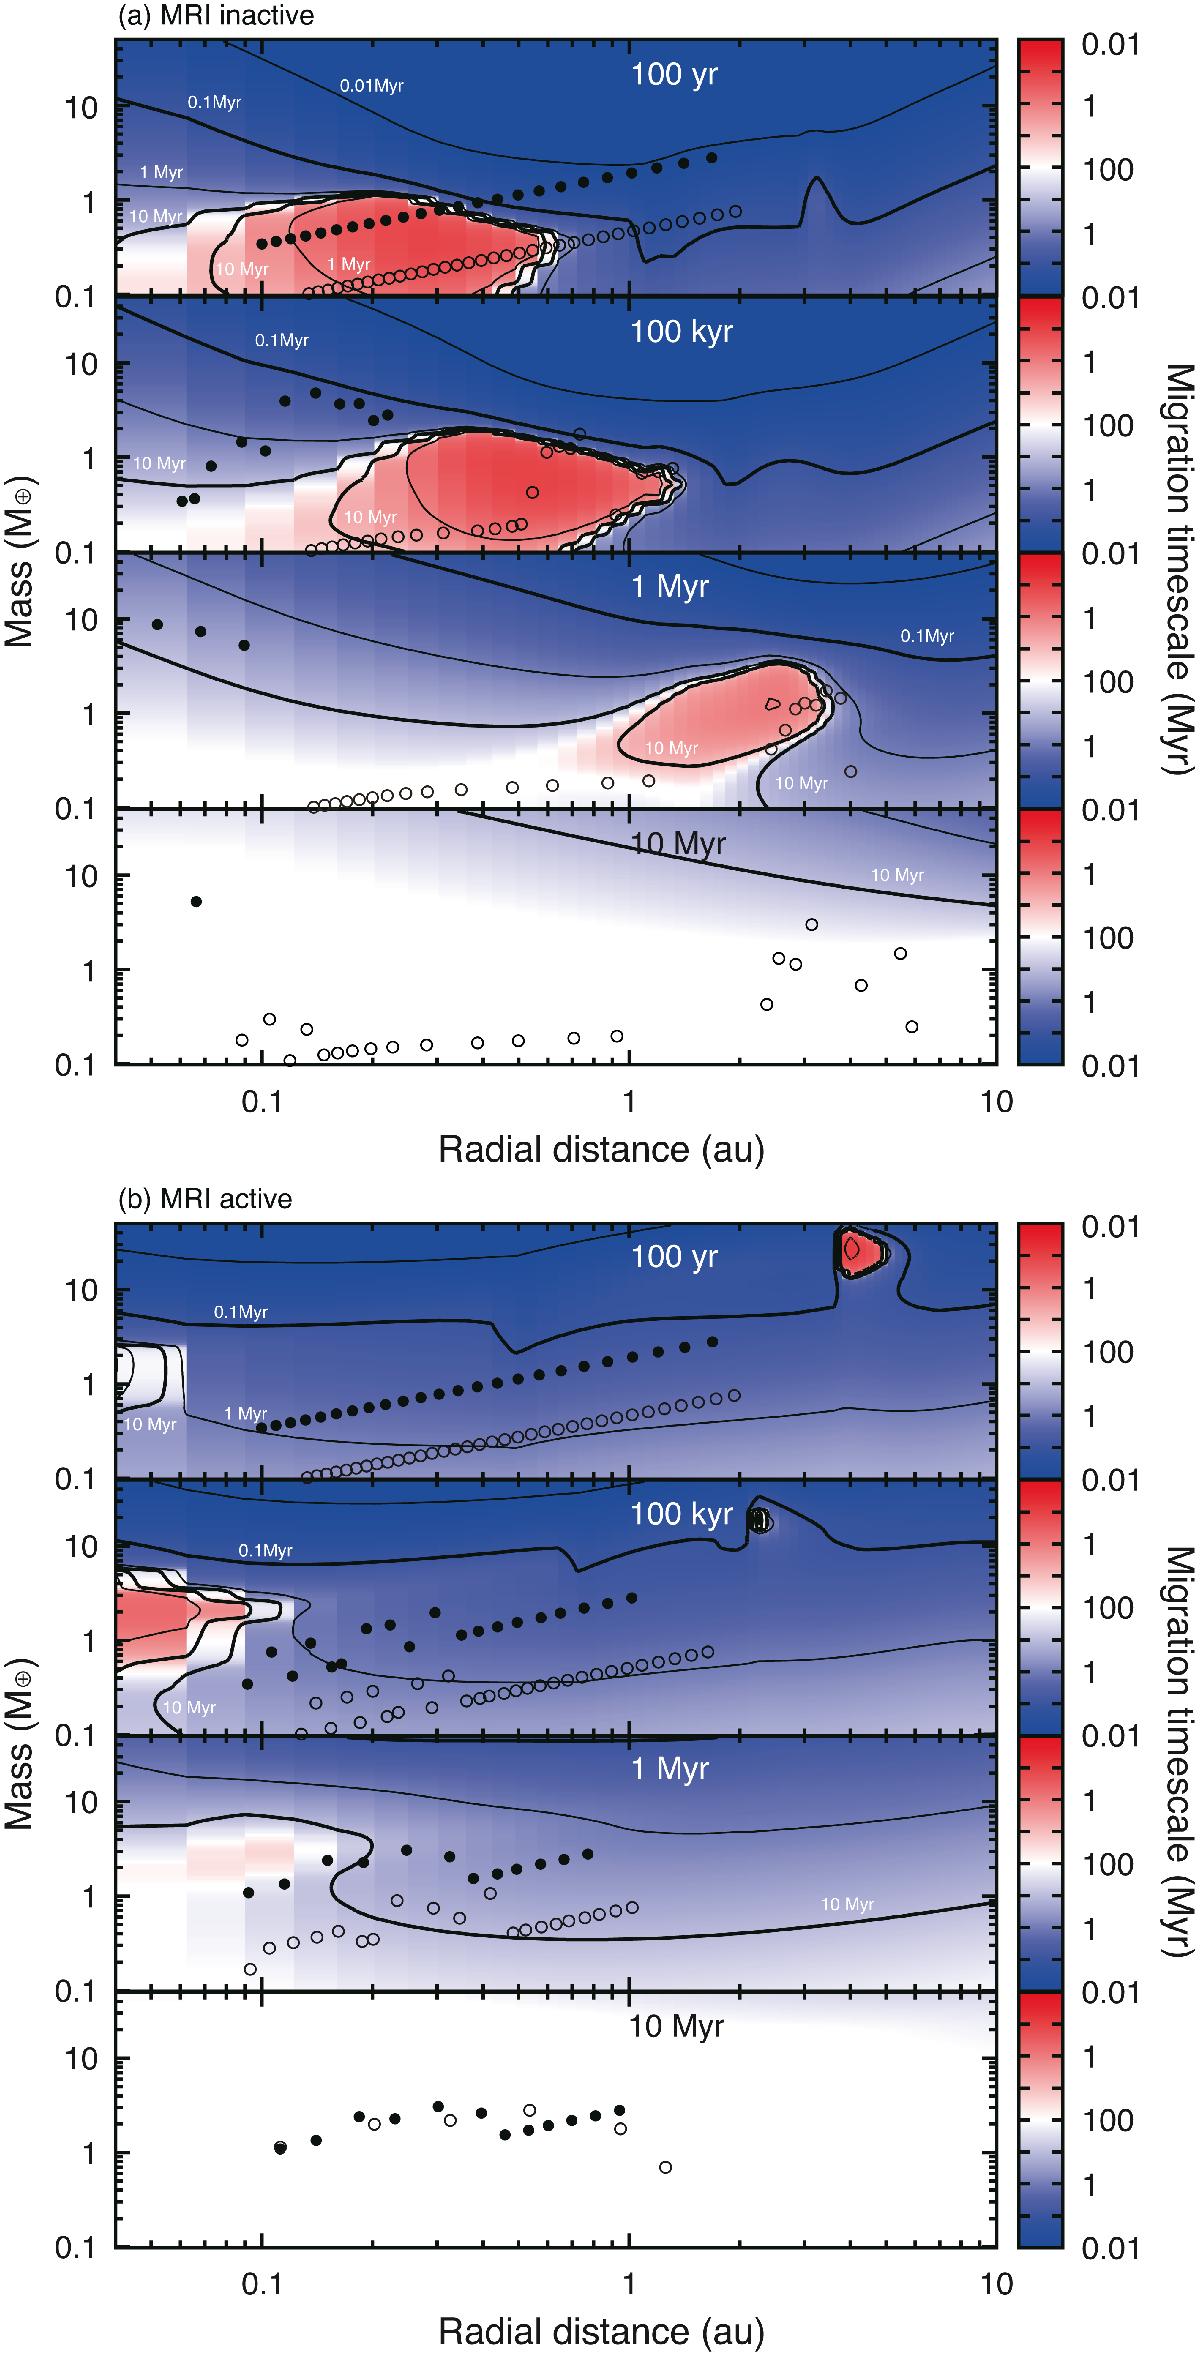
Migration maps of MRI-inactive disks (![]() ) and MRI-active disks (
) and MRI-active disks (![]() ) based on case A prescription. The color indicates the migration timescale. In the blue region, planet migration is inward, while in the red region planets undergo outward migration. Snapshots of systems of N-body simulations are also shown by open circles (Σ0 = 30) and filled circles (Σ0 = 75), respectively.
) based on case A prescription. The color indicates the migration timescale. In the blue region, planet migration is inward, while in the red region planets undergo outward migration. Snapshots of systems of N-body simulations are also shown by open circles (Σ0 = 30) and filled circles (Σ0 = 75), respectively.
Current usage metrics show cumulative count of Article Views (full-text article views including HTML views, PDF and ePub downloads, according to the available data) and Abstracts Views on Vision4Press platform.
Data correspond to usage on the plateform after 2015. The current usage metrics is available 48-96 hours after online publication and is updated daily on week days.
Initial download of the metrics may take a while.