Fig. 2
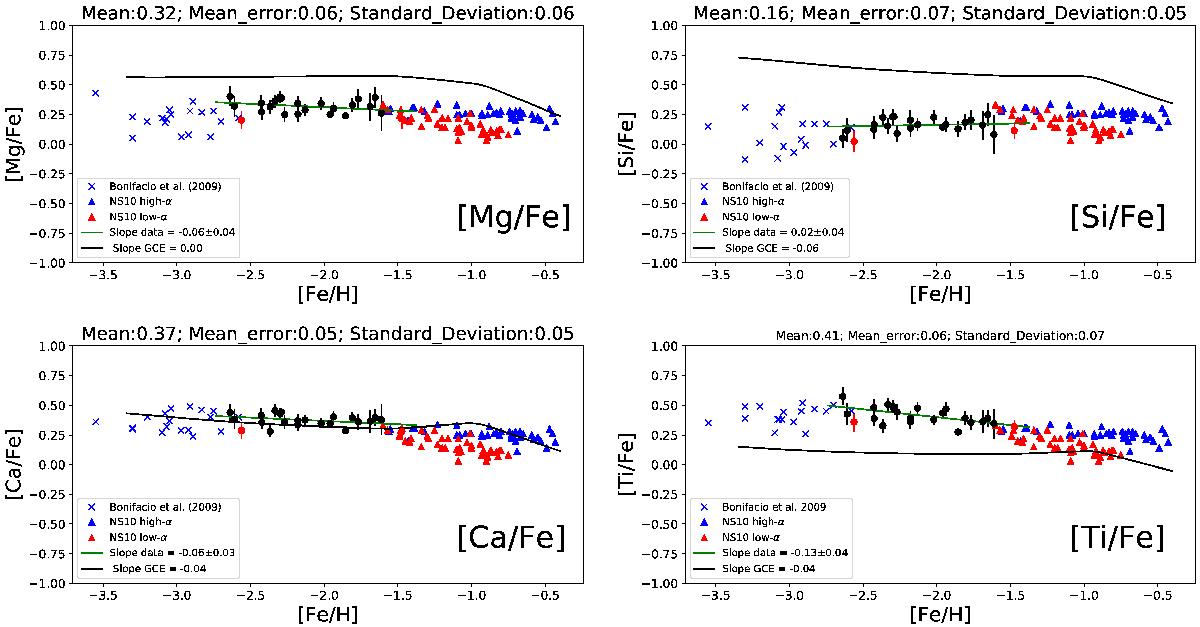
[X/Fe] abundances for α-elements (Mg, Si, Ca and Ti). The green line represent the best linear fit to the data and the slope is shown in the plots. The black line is the GCE prediction. The mean differential, our errors and the standard star-to-star scatter (standard deviation) for each element (for our measurements) are shown in top of each panel. The blue crosses are data of EMP stars from Bonifacio et al. (2009), the blue and red triangles are metal-poor stars from Nissen & Schuster (2010), the black filled circles are the data measured in this work and the red filled circles are the blue straggler stars from this sample.
Current usage metrics show cumulative count of Article Views (full-text article views including HTML views, PDF and ePub downloads, according to the available data) and Abstracts Views on Vision4Press platform.
Data correspond to usage on the plateform after 2015. The current usage metrics is available 48-96 hours after online publication and is updated daily on week days.
Initial download of the metrics may take a while.