Fig. 8
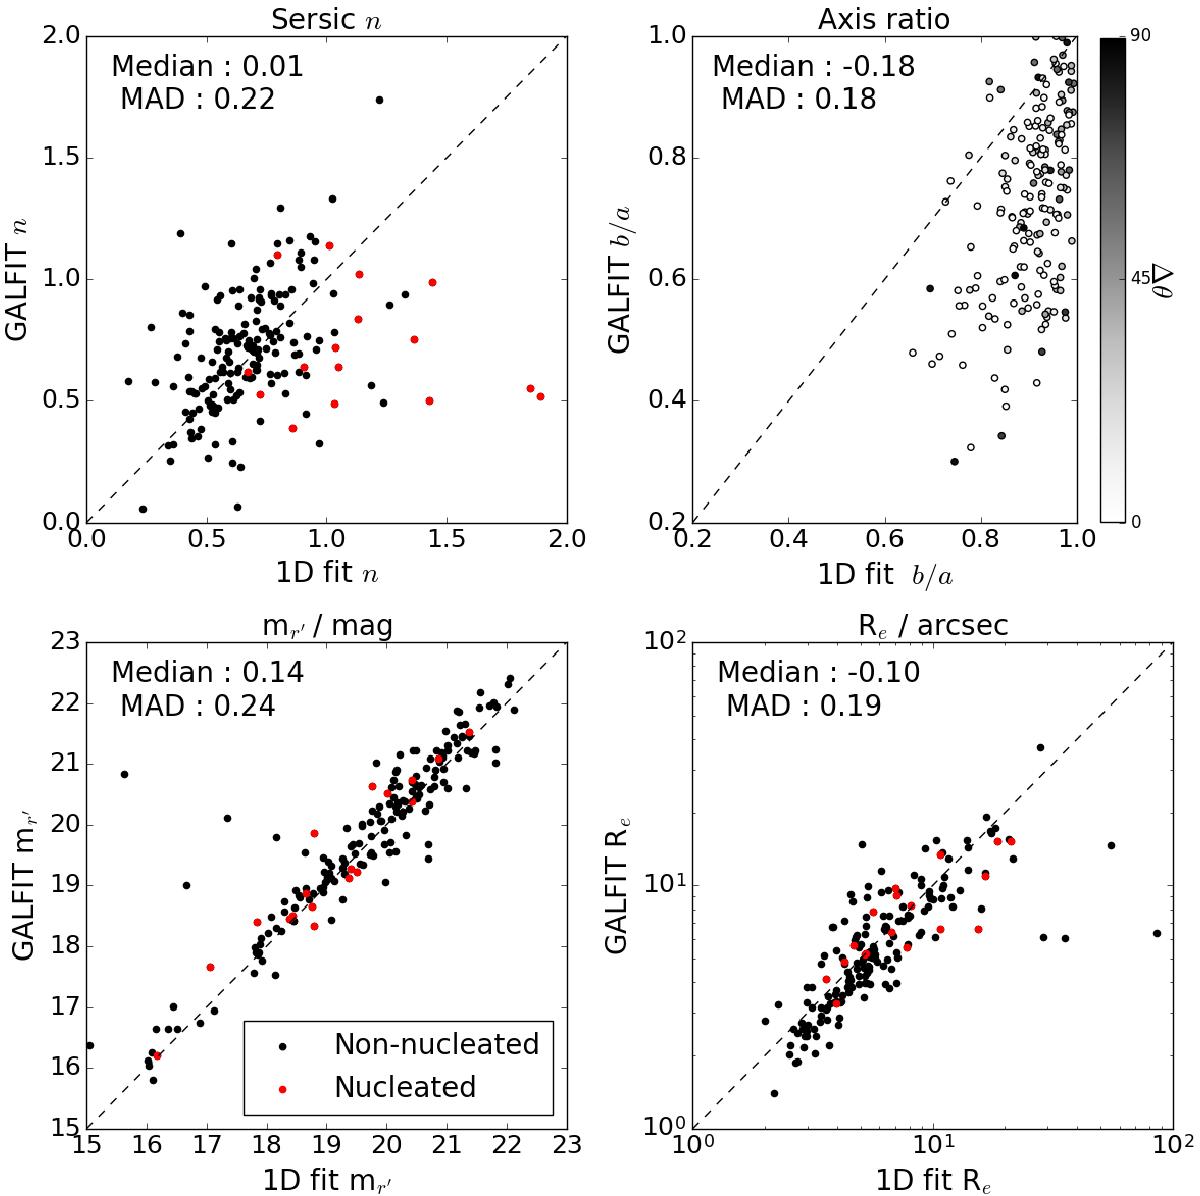
Comparison of the parameters obtained using the different photometric methods explained in Sect. 5: the x-axes correspond to the 1D fit and y-axes to the 2D GALFIT model. The upper panels compare the Sérsic n-values (upper left) and axis ratios b/a (upper right), whereas the lower panels compare the r′-band magnitudes mr′ (lower left) and the effective radii Re (lower right). The differences in the position angles obtained by the two methods are indicated with gray scale colors in the upper right panel; dark colors correspond to a large difference, and light colors to a small difference. The most obvious difference appears between the b/a-values, which are systematically closer to unity when calculated using the 1D method. The galaxies which have a nucleus are marked in red. The median differences (n2d−n1d, b/a2d−b/a1d, mr′,2d−mr′,1d, 2 × (Re,2d−Re,1d)/(Re,2d + Re,1d)), and the corresponding median absolute differences (MAD = Median(|Median(xi)−xi|)), where xi is the difference between 2D- and 1D-measurements) are reported in the upper left corner of the plots.
Current usage metrics show cumulative count of Article Views (full-text article views including HTML views, PDF and ePub downloads, according to the available data) and Abstracts Views on Vision4Press platform.
Data correspond to usage on the plateform after 2015. The current usage metrics is available 48-96 hours after online publication and is updated daily on week days.
Initial download of the metrics may take a while.