Fig. 7
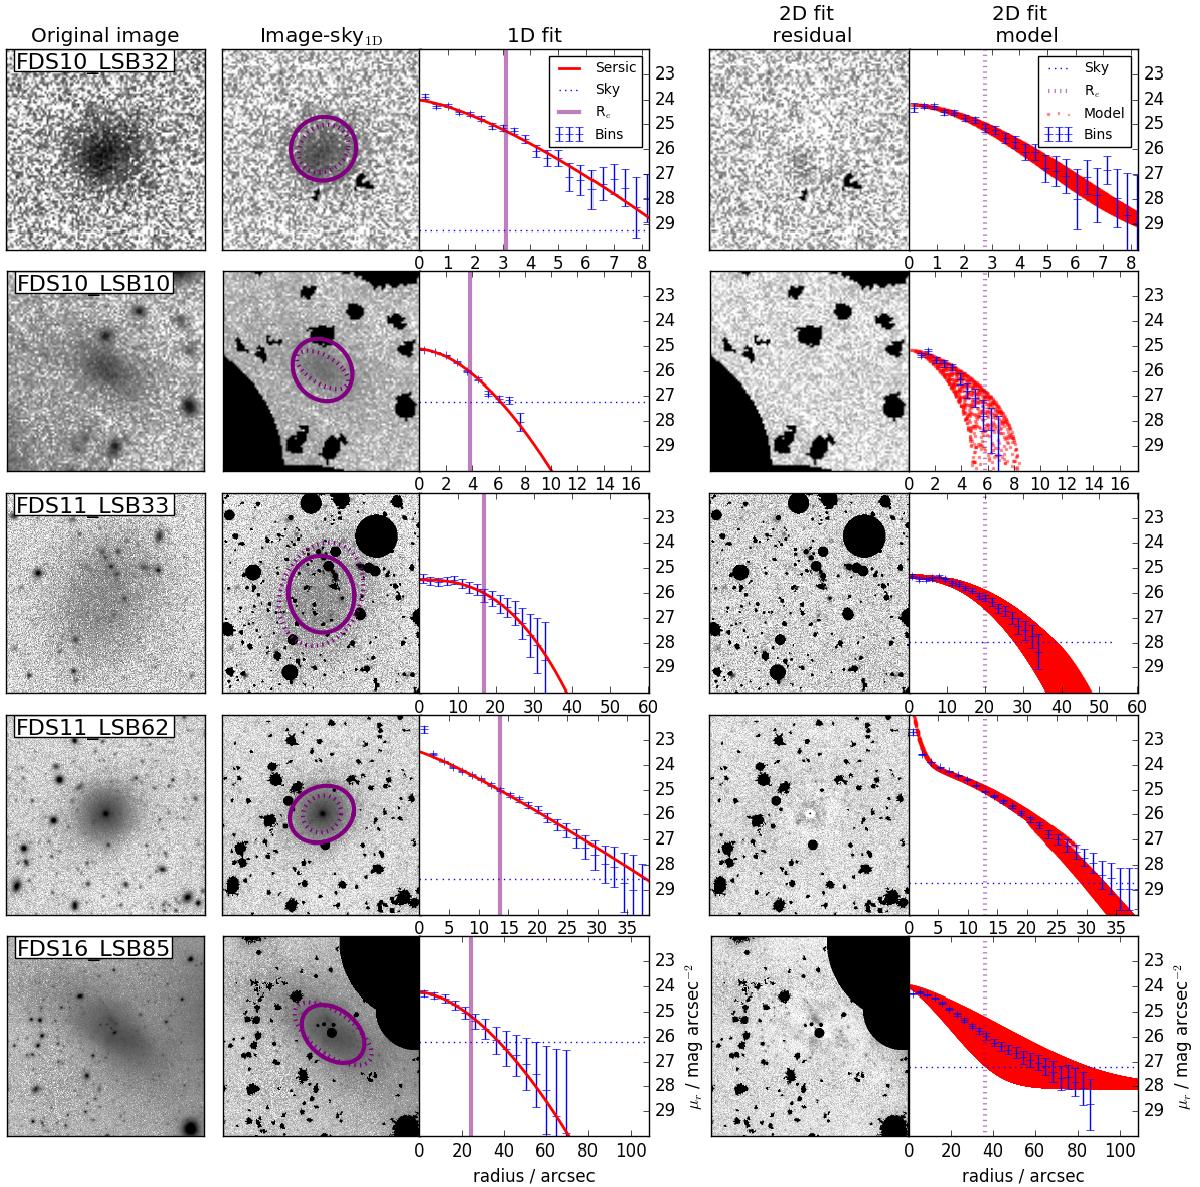
Comparison of the two photometric methods for individual galaxies. Explanations for the columns from left to right: the first frame shows the r′-band postage image of the galaxy. The second frame shows the sky subtracted and masked image, with the elliptical bin shapes at Re over-plotted using purple color (solid line: shape using pixel distribution moments, dotted line: shape using GALFIT). The third frameshows the sky-subtracted 1D radial profile derived using the azimuthally averaged bins, with the Sérsic fit, effective radius (Re) from 1D fit, and the measured sky level over-plotted. The blue dashed line marks the level of the residual sky measured using the sectors at 4 Re. The fourth frame shows the residual image after subtracting the 2D GALFIT model. The last frameshows the azimuthally averaged radial profile measured using the elliptical shape from GALFIT. The red dots correspond to each pixel of the (2D) GALFIT model (pixel value as a function of the distance from the center), the purple dotted line shows the corresponding effective radius, and the blue dotted line shows the sky level from the GALFIT decomposition. The distribution moments fail to measure the actual isophotal shape of the second galaxy from the top. This can be seen as a misalignment between the purple solid ellipse and the actual galaxy shape in the second column image. The fourth galaxy from the top possesses a nucleus, which can be seen as a peak in the radial bins (the 3rd and 5th panels from the left). Only the GALFIT model contrives to fit the nucleus.
Current usage metrics show cumulative count of Article Views (full-text article views including HTML views, PDF and ePub downloads, according to the available data) and Abstracts Views on Vision4Press platform.
Data correspond to usage on the plateform after 2015. The current usage metrics is available 48-96 hours after online publication and is updated daily on week days.
Initial download of the metrics may take a while.