Fig. 6
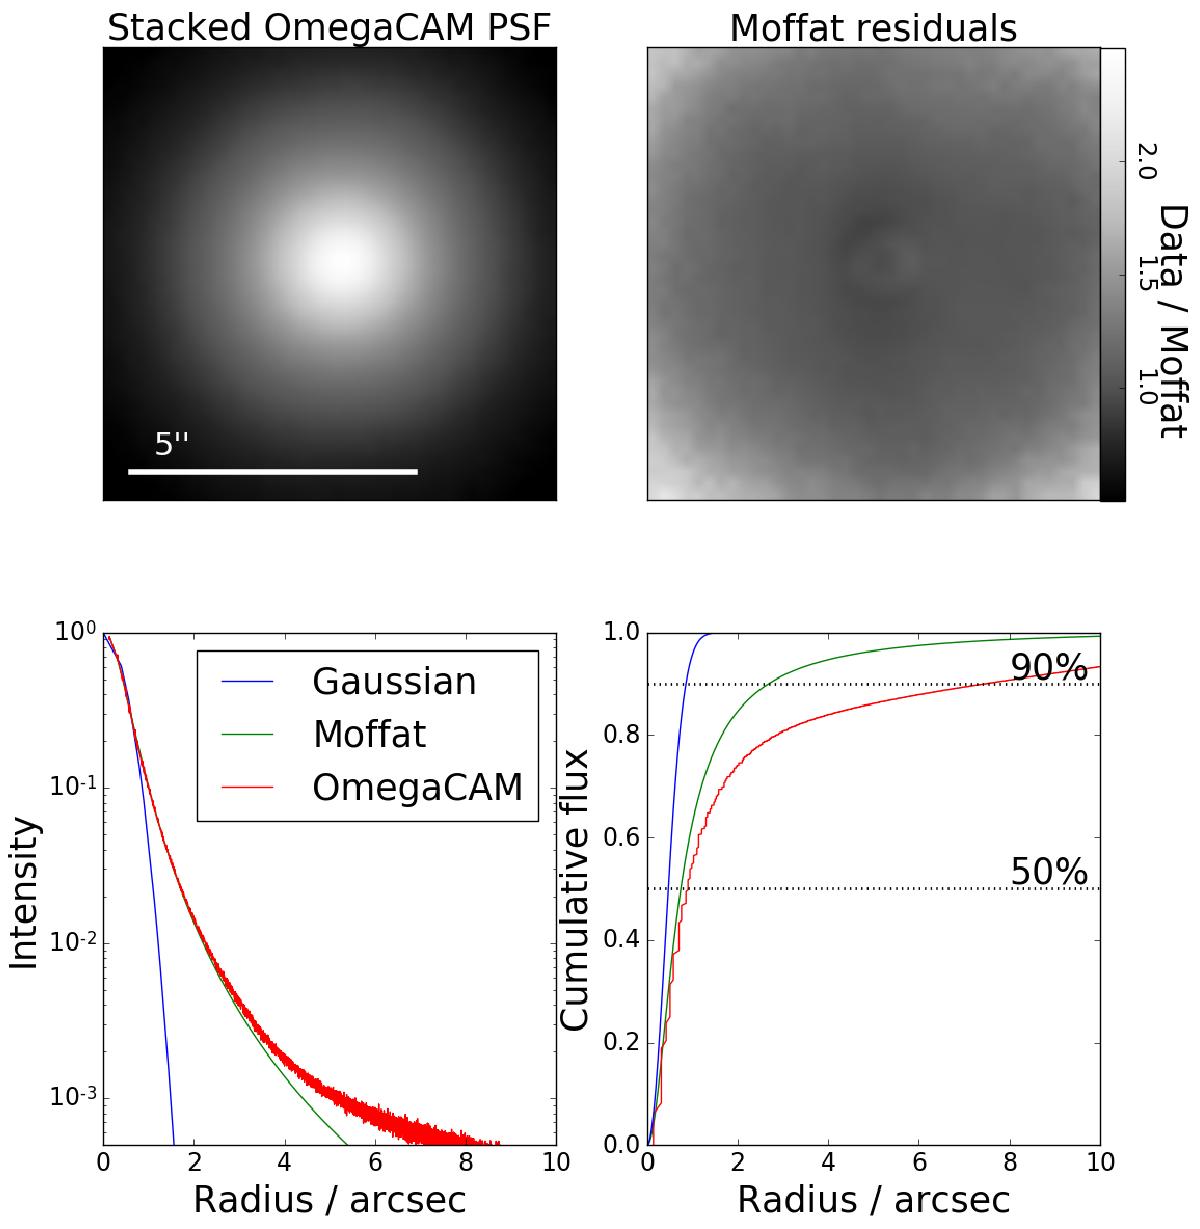
Upper panels: PSF images, averaged from the field 11 in the r′-band observations (upper left) and the stack model divided with the best fit Moffat model (upper right). Lower left: the stacked radial intensity profile of the averaged PSF (OmegaCAM) is compared with Gaussian and Moffat fits to that profile. All the models are normalized by their central intensity. Lower right: cumulative profiles of the average observed PSF, and the Gaussian and Moffat fits. The horizontal dotted lines show the levels where 90% and 50% of the light are included.
Current usage metrics show cumulative count of Article Views (full-text article views including HTML views, PDF and ePub downloads, according to the available data) and Abstracts Views on Vision4Press platform.
Data correspond to usage on the plateform after 2015. The current usage metrics is available 48-96 hours after online publication and is updated daily on week days.
Initial download of the metrics may take a while.