Fig. 19
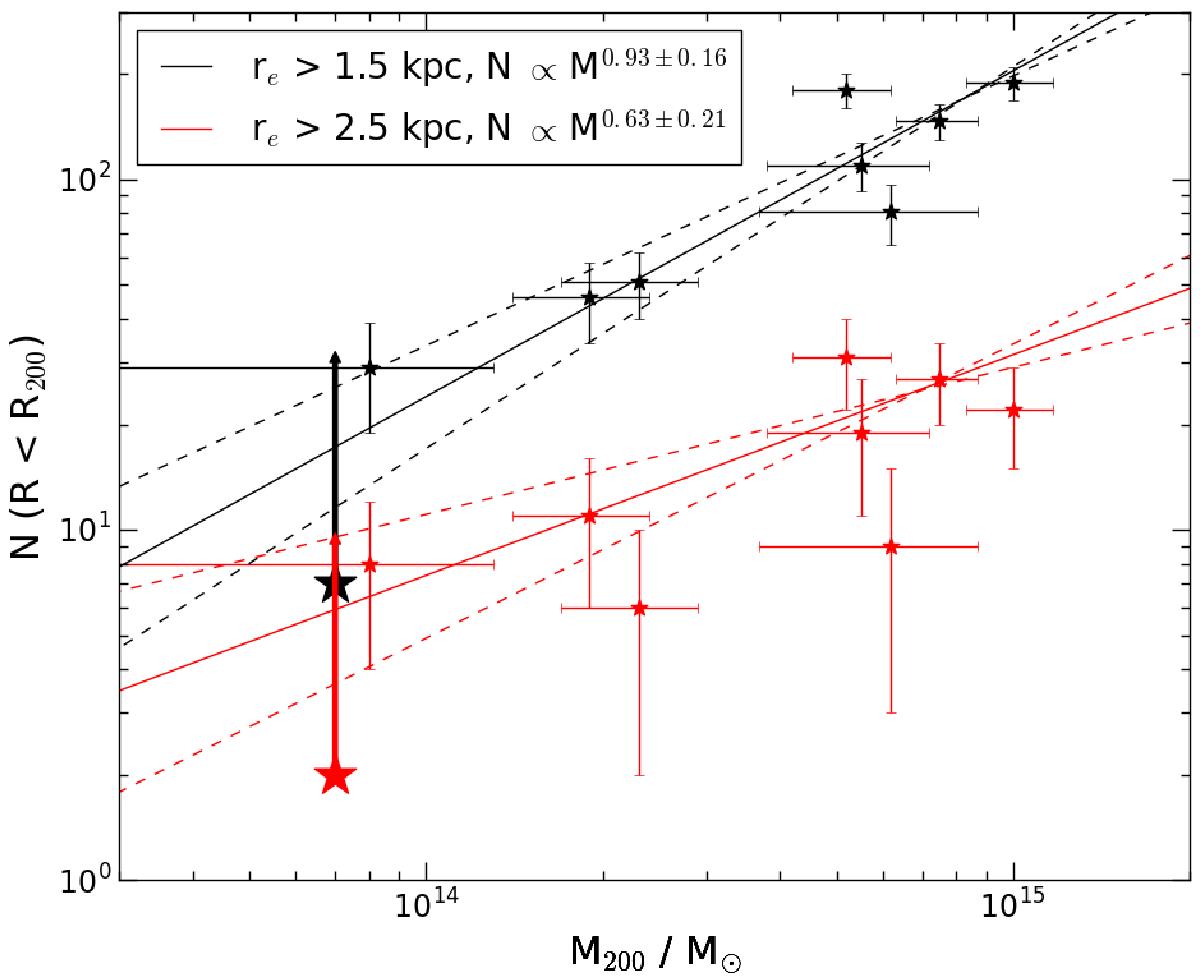
Relation between the cluster mass (M200) and the number of UDGs within the virial radius (R200) in galaxy clusters at 0.044 <z< 0.063 is shown with black points (van der Burg et al. 2016). The red symbols show the same relation for the UDGs with Re> 2.5 kpc. The observed values from our sample are marked with the large symbols, with the extrapolated upper limits shown with the arrows.
Current usage metrics show cumulative count of Article Views (full-text article views including HTML views, PDF and ePub downloads, according to the available data) and Abstracts Views on Vision4Press platform.
Data correspond to usage on the plateform after 2015. The current usage metrics is available 48-96 hours after online publication and is updated daily on week days.
Initial download of the metrics may take a while.