Fig. 18
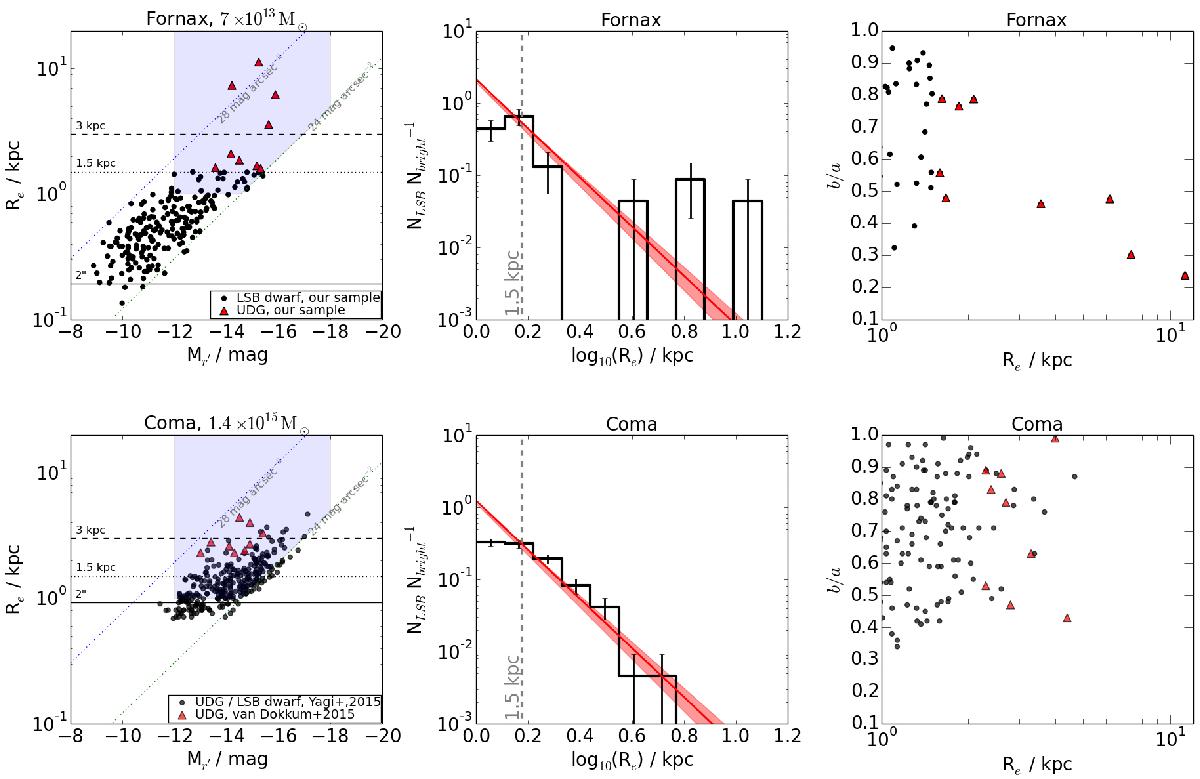
Left panels: luminosity-size relation of the known UDGs, and of the LSB dwarf galaxies within two cluster core radii in the Fornax (upper) and Coma (lower) clusters. The two horizontal lines represent the effective radii of 1.5 kpc and 3 kpc. The black points and the red triangles in the upper left panel show the LSB dwarfs and UDGs in our sample, respectively, and the black points, and the red triangles in the lower left plot correspond to the LSB dwarfs and UDGs from Yagi et al. (2016) and van Dokkum et al. (2015), respectively. The blue areas show the selection limits of the middle and right panels. Middle panels: number distribution of effective radii normalized by the number of bright galaxies in the studied area. The dashed lines show the scaled n[dex-1] ∝![]() relation found (van der Burg et al. 2016) between the number of UDGs with a given effective radius in logarithmic bins. The solid vertical lines in the middle of the bins show the Poisson noise uncertainties in the bins. Right panels: axis ratios of the selected galaxies in Fornax (upper right panel) and Coma (lower right panel) against their effective radii.
relation found (van der Burg et al. 2016) between the number of UDGs with a given effective radius in logarithmic bins. The solid vertical lines in the middle of the bins show the Poisson noise uncertainties in the bins. Right panels: axis ratios of the selected galaxies in Fornax (upper right panel) and Coma (lower right panel) against their effective radii.
Current usage metrics show cumulative count of Article Views (full-text article views including HTML views, PDF and ePub downloads, according to the available data) and Abstracts Views on Vision4Press platform.
Data correspond to usage on the plateform after 2015. The current usage metrics is available 48-96 hours after online publication and is updated daily on week days.
Initial download of the metrics may take a while.