Fig. 16
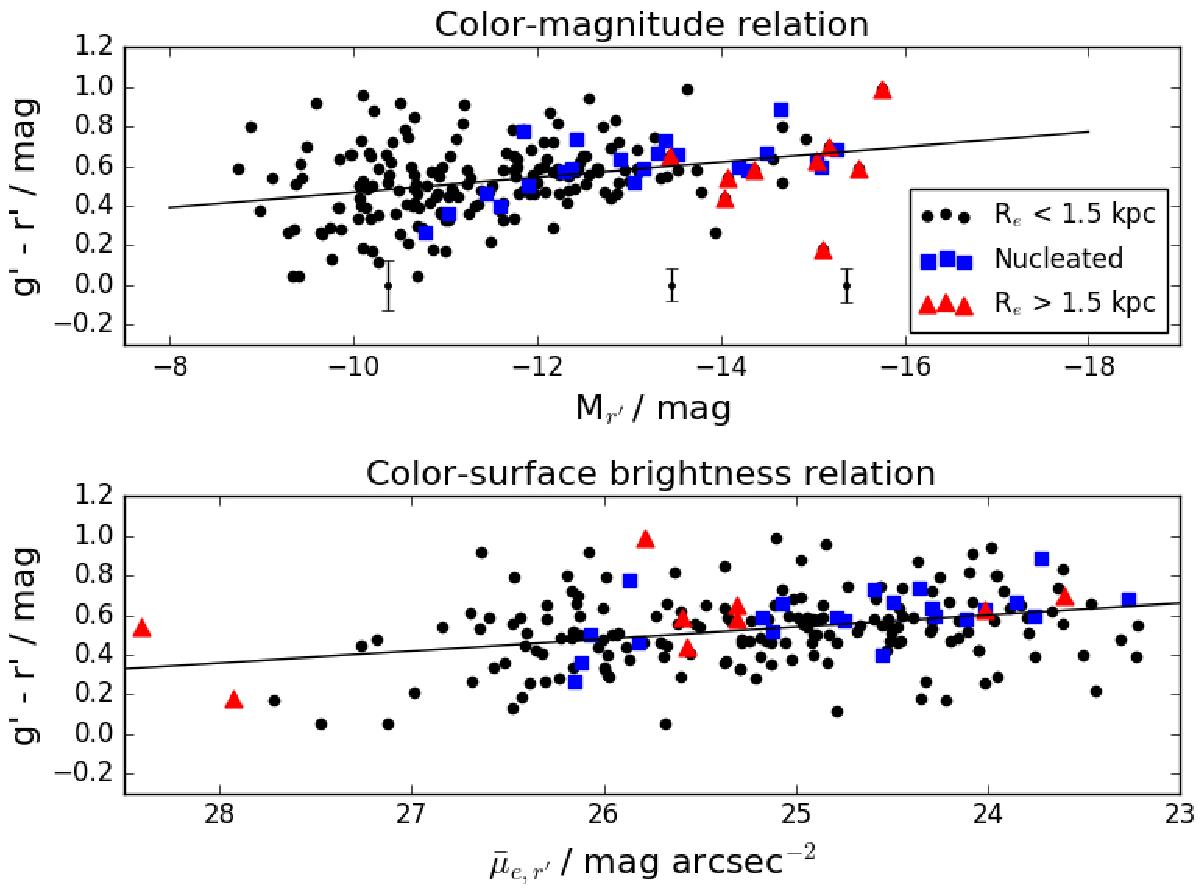
Upper panel: color–magnitude relation shown for the galaxies with effective radius Re< 1.5 kpc for nucleated (blue squares) and non-nucleated galaxies (black points), and for the UDGs with Re> 1.5 kpc, (red triangles) in our sample. The black line shows the linear least squares fit to the data points. The g′−r′ colors are measured with an elliptical aperture with semi major axis of Re taken from GALFIT. The errorbars below the points show the size of the errors (Eq. (7)) along the color–magnitude relation. Lower panel: the color-surface brightness relation of the galaxies in our sample. The symbols are the same as in the upper plot.
Current usage metrics show cumulative count of Article Views (full-text article views including HTML views, PDF and ePub downloads, according to the available data) and Abstracts Views on Vision4Press platform.
Data correspond to usage on the plateform after 2015. The current usage metrics is available 48-96 hours after online publication and is updated daily on week days.
Initial download of the metrics may take a while.