Fig. 15
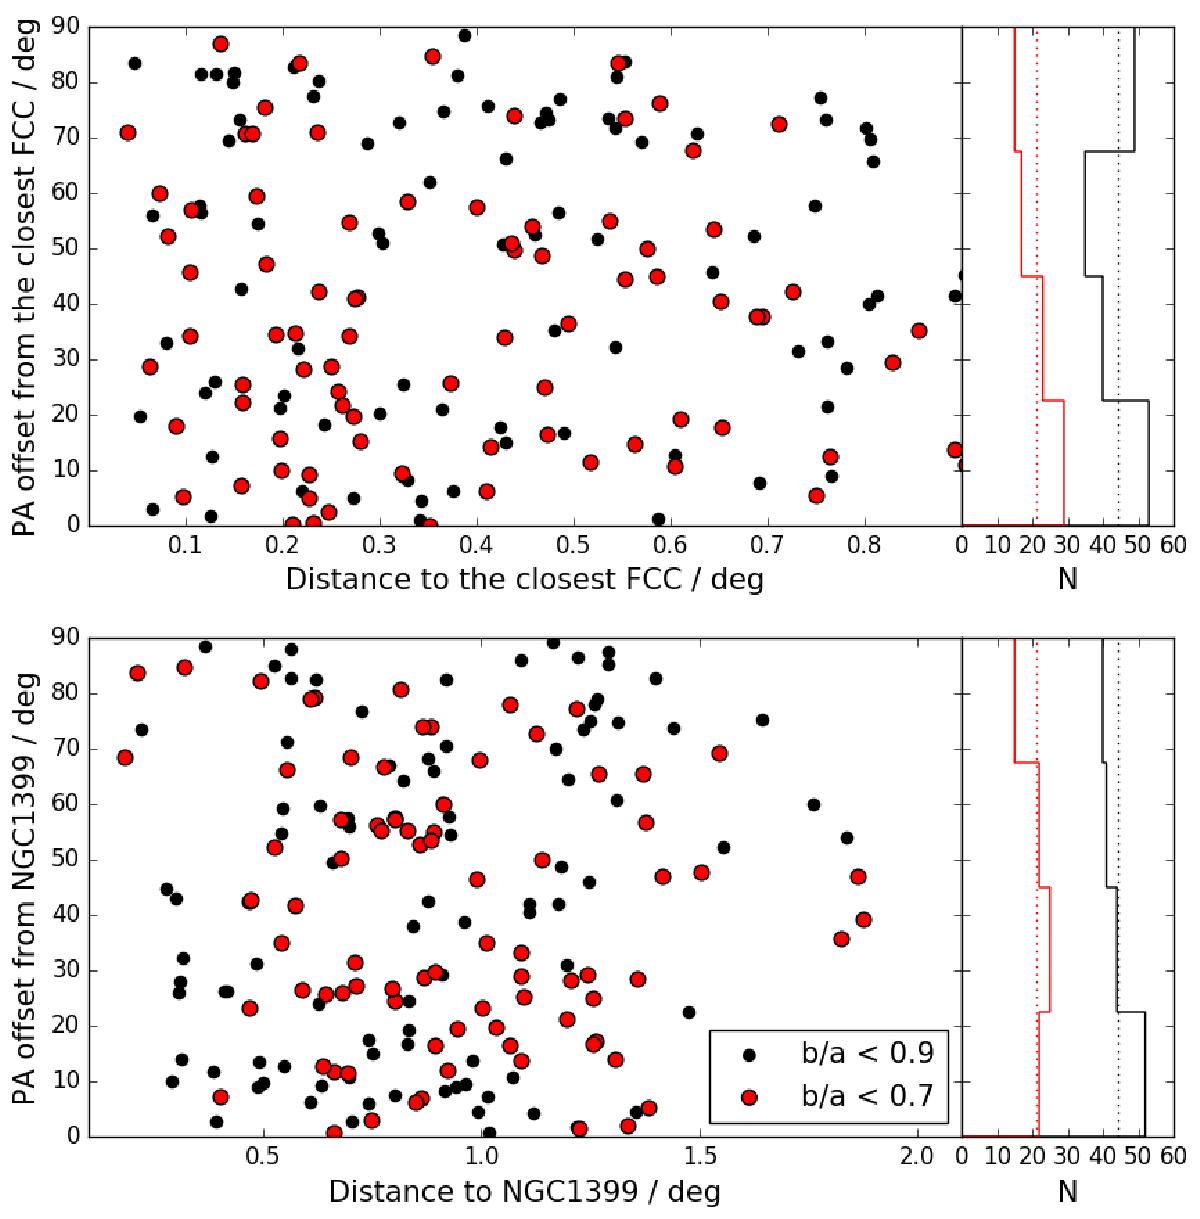
Upper plot: difference between the position angle of our sample galaxy, and the position angle of the line drawn from the galaxy to the closest FCC galaxy with Mr′ < −18 mag. Bottom plot: difference between the position angle of our sample galaxies and the position angle of the line drawn from that galaxy to NGC 1399. The red and the black dots correspond to the galaxies with b/a < 0.7 and <0.9, respectively. The vertical histograms show the number distributions of the points in the scatter plots. The red and black histograms correspond to the red and black points, respectively.
Current usage metrics show cumulative count of Article Views (full-text article views including HTML views, PDF and ePub downloads, according to the available data) and Abstracts Views on Vision4Press platform.
Data correspond to usage on the plateform after 2015. The current usage metrics is available 48-96 hours after online publication and is updated daily on week days.
Initial download of the metrics may take a while.