Fig. 13
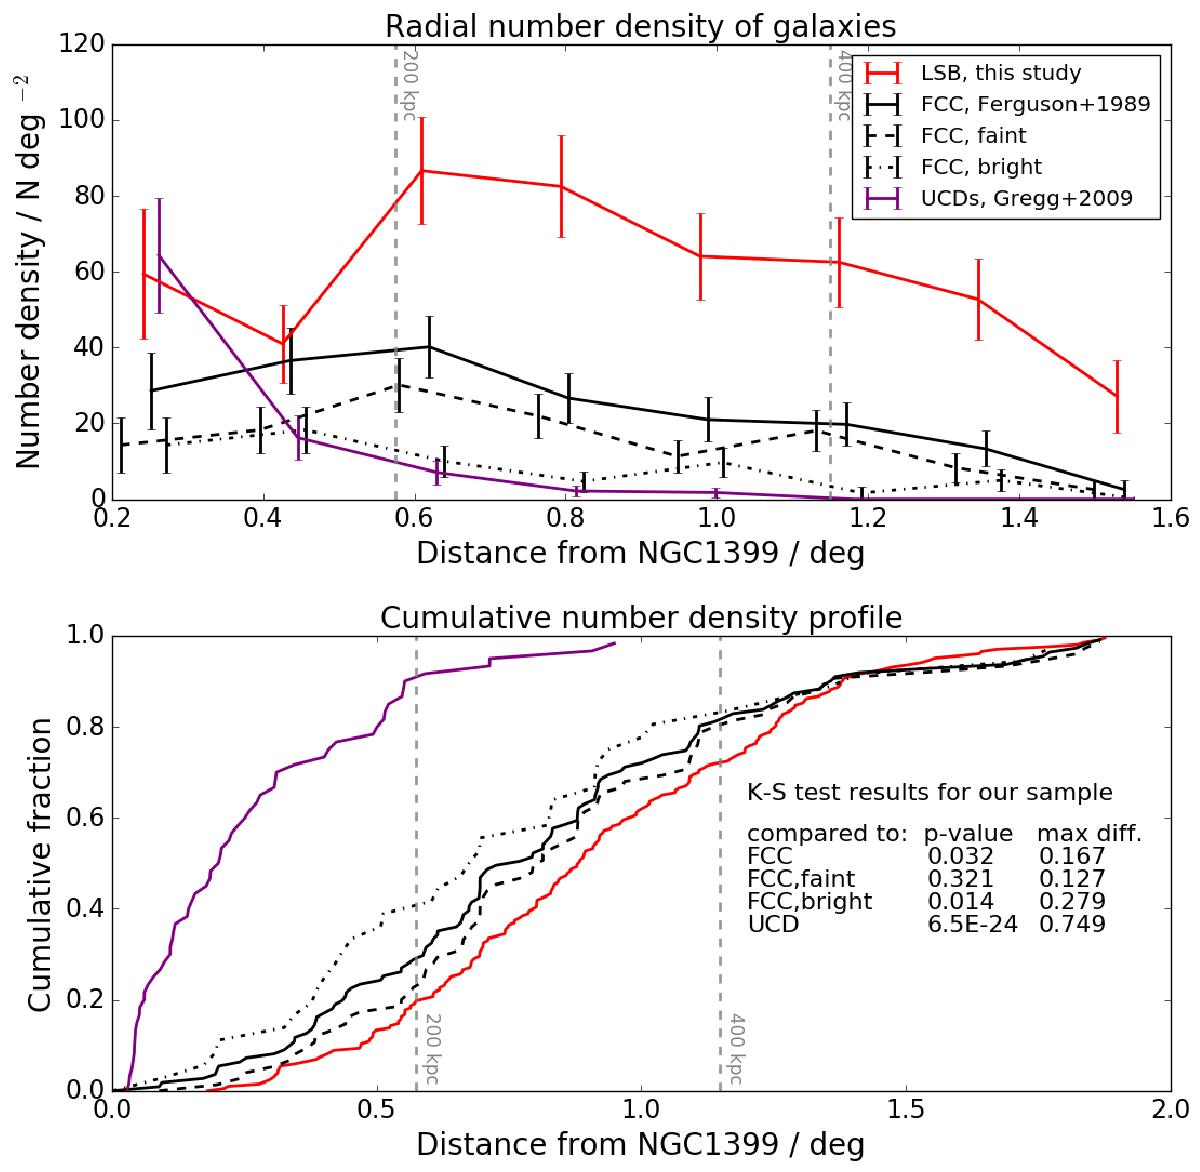
Radial number density profile of the LSB dwarfs in our sample (red line) is compared with that of all galaxies in FCC (black line). We plot also the ultra compact dwarfs from Gregg et al. (2009; purple line). Plotted separately are also the high surface brightness (with ![]() mag arcsec-2) and LSB (
mag arcsec-2) and LSB (![]() mag arcsec-2) galaxies from FCC, indicated by semi-dotted and the dashed lines, respectively. The results of the K-S tests comparing our sample distribution with those of the other surveys are listed in the lower right corner of the lower panel.
mag arcsec-2) galaxies from FCC, indicated by semi-dotted and the dashed lines, respectively. The results of the K-S tests comparing our sample distribution with those of the other surveys are listed in the lower right corner of the lower panel.
Current usage metrics show cumulative count of Article Views (full-text article views including HTML views, PDF and ePub downloads, according to the available data) and Abstracts Views on Vision4Press platform.
Data correspond to usage on the plateform after 2015. The current usage metrics is available 48-96 hours after online publication and is updated daily on week days.
Initial download of the metrics may take a while.