Fig. 11
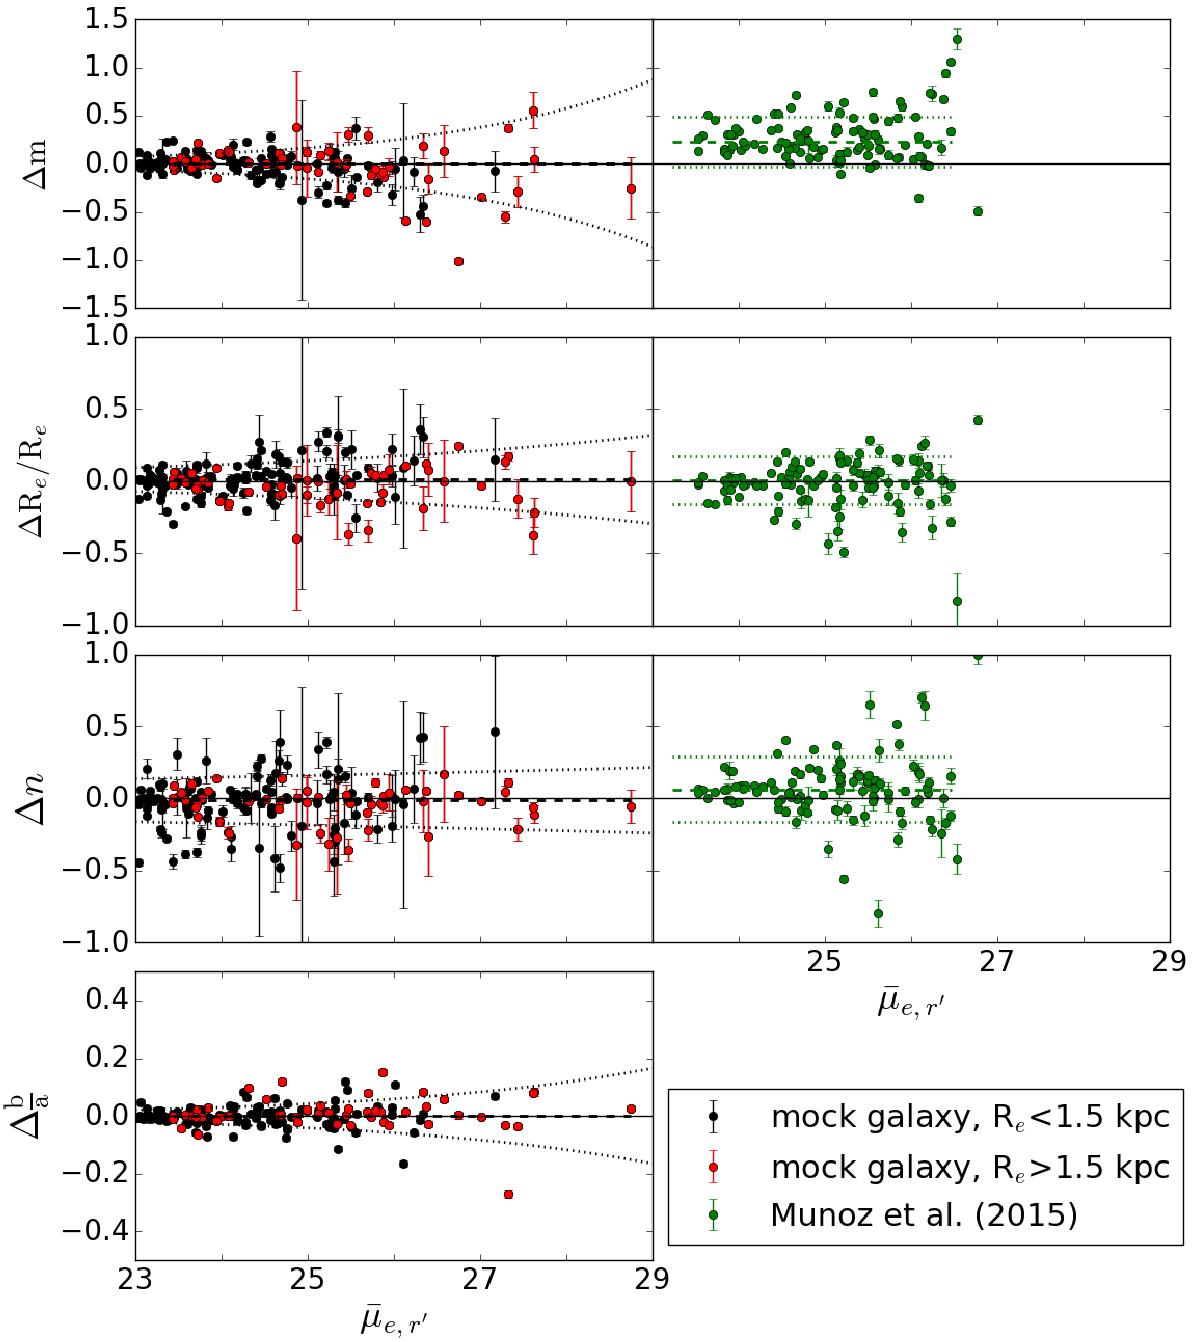
Left panels: difference between the input and output parameters for the mock galaxies. The mock galaxies with effective radii Re> 1.5 kpc, and those smaller than that are plotted with red and black dots, respectively. From top to bottom they show the differences (input – output) of apparent magnitudes (Δm), effective radii (ΔRe/Re), and values of the Sérsic n (Δn), as a function of the mean effective surface brightness ![]() . Right panels: comparison of our measurements with the values measured by Muñoz et al. (2015) for the galaxies common in the two studies. The differences in axis ratios (
. Right panels: comparison of our measurements with the values measured by Muñoz et al. (2015) for the galaxies common in the two studies. The differences in axis ratios (![]() ) are only shown for the mock galaxies, since these values are not available for the galaxies of Munoz et al. Since the magnitudes in Muñoz et al. (2015) are in i′-band, we have added the median r′−i′ color of 0.3 mag to their values before the comparison. The errorbars represent the formal errors from our GALFIT fits. The dotted lines in the left panels show the 1σ-deviations given by Eq. (6). In the right panels, the dotted lines show the standard deviations of the differences of the compared measurements. The dashed lines show the mean differences between the compared values.
) are only shown for the mock galaxies, since these values are not available for the galaxies of Munoz et al. Since the magnitudes in Muñoz et al. (2015) are in i′-band, we have added the median r′−i′ color of 0.3 mag to their values before the comparison. The errorbars represent the formal errors from our GALFIT fits. The dotted lines in the left panels show the 1σ-deviations given by Eq. (6). In the right panels, the dotted lines show the standard deviations of the differences of the compared measurements. The dashed lines show the mean differences between the compared values.
Current usage metrics show cumulative count of Article Views (full-text article views including HTML views, PDF and ePub downloads, according to the available data) and Abstracts Views on Vision4Press platform.
Data correspond to usage on the plateform after 2015. The current usage metrics is available 48-96 hours after online publication and is updated daily on week days.
Initial download of the metrics may take a while.