Fig. 10
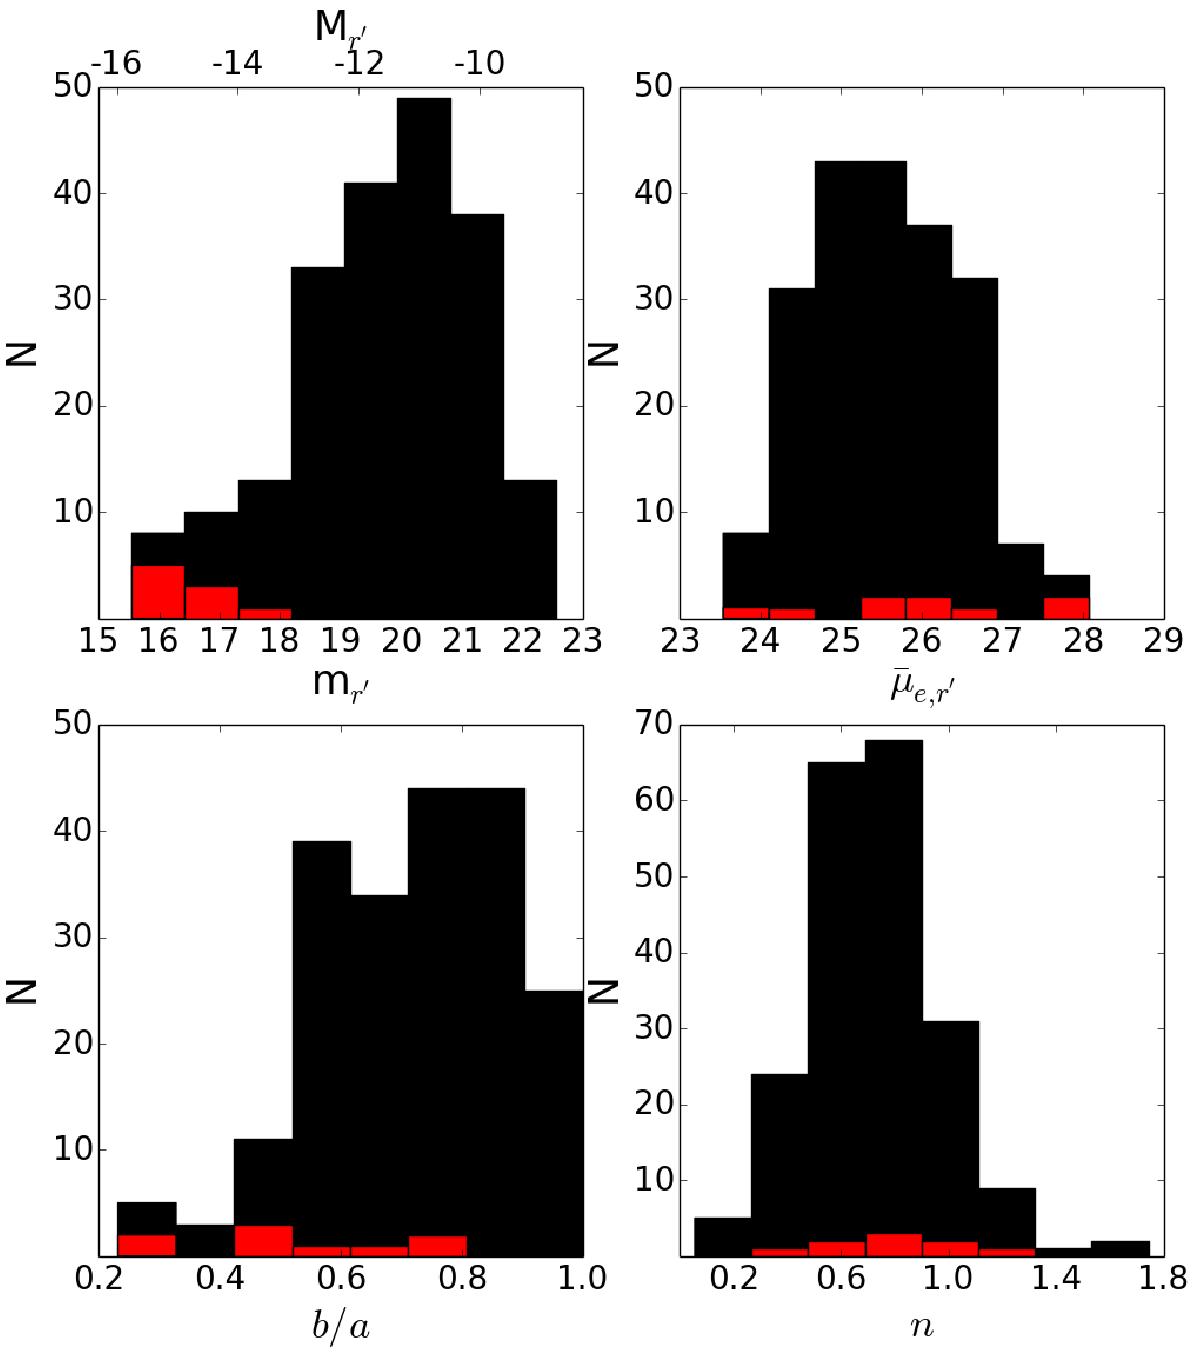
Histograms of the apparent magnitudes mr′ (upper left panel), mean effective surface brightnesses ![]() (upper right panel), axis ratios b/a (lower left panel), and the Sérsic n-values (lower right panel) obtained with GALFIT. The black histograms show the distributions for the total sample, and the red histograms those for the UDGs.
(upper right panel), axis ratios b/a (lower left panel), and the Sérsic n-values (lower right panel) obtained with GALFIT. The black histograms show the distributions for the total sample, and the red histograms those for the UDGs.
Current usage metrics show cumulative count of Article Views (full-text article views including HTML views, PDF and ePub downloads, according to the available data) and Abstracts Views on Vision4Press platform.
Data correspond to usage on the plateform after 2015. The current usage metrics is available 48-96 hours after online publication and is updated daily on week days.
Initial download of the metrics may take a while.