Free Access
Fig. 1
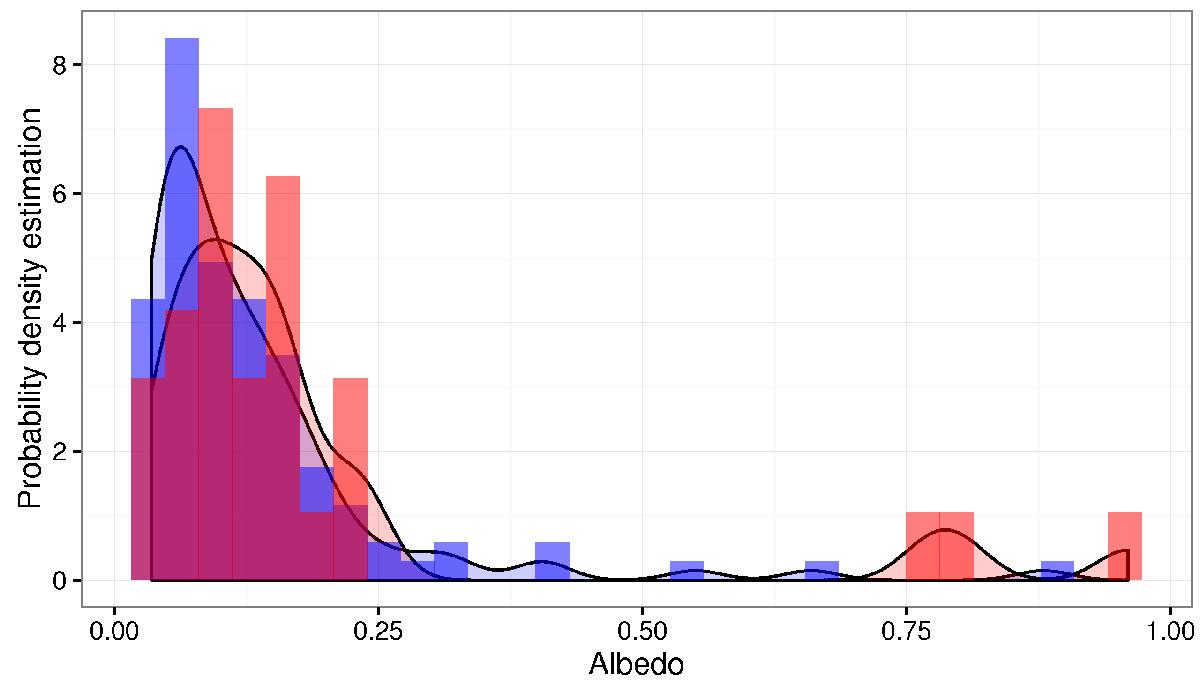
Empirical albedo distributions of multiple and single TNOs. Red and blue histograms are constructed from the TNBs and TNOs datasets respectively. The solid lines mean the probability density functions estimation (kernel estimation, Parzen 1962), shaded in red and blue for the TNBs and TNOs datasets respectively.
Current usage metrics show cumulative count of Article Views (full-text article views including HTML views, PDF and ePub downloads, according to the available data) and Abstracts Views on Vision4Press platform.
Data correspond to usage on the plateform after 2015. The current usage metrics is available 48-96 hours after online publication and is updated daily on week days.
Initial download of the metrics may take a while.