Fig. 9
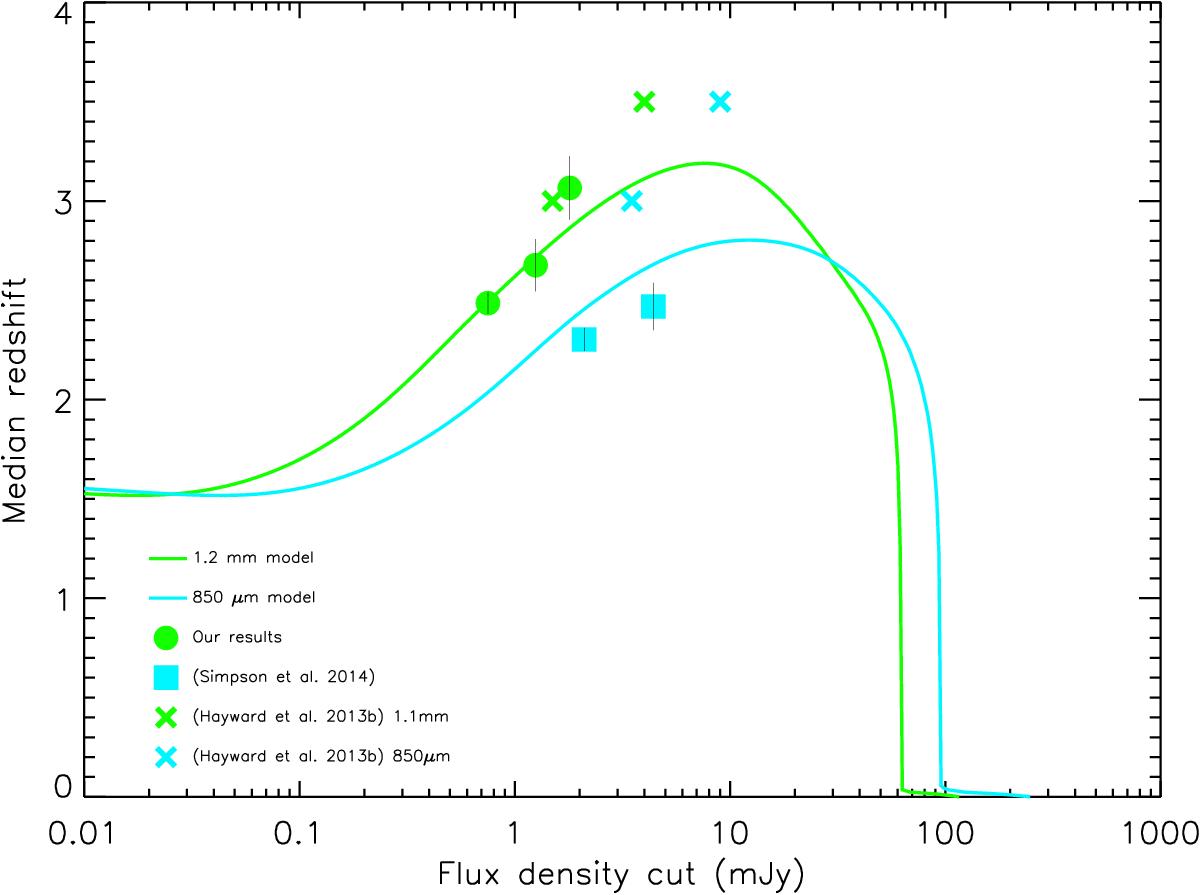
Green circles denote our survey results which include the extended sample above the characteristic flux limit of 750 μJy, and also cut at S1.25 mm > 1.25 mJy and S1.25 mm > 1.8 mJy. Cyan squares denote results from Simpson et al. (2014), including the sample above their characteristic flux limit of 2.1 mJy and also cut at S870 μm > 4.4 mJy such that half their sample is included. Plotted results and error bars represent the medians calculated through our Monte-Carlo trials and the extent of 68% of the median values. Median redshift as a function of survey flux density limit is also shown. The green and cyan lines give model predictions based on Béthermin et al. (2015). Models from Hayward et al. (2013b), plotted as green (blue) crosses, give mean redshift estimates for 1.1 mm (850 μm) at flux density limits of S1.1 mm > 1.5 mJy and S1.1 mm > 4.0 mJy (S850 μm > 3.5 mJy and S850 μm > 9.0 mJy). Our observed redshift distribution rises with increasing flux density limits, consistent with both the models of Béthermin et al. (2015) and Hayward et al. (2013b).
Current usage metrics show cumulative count of Article Views (full-text article views including HTML views, PDF and ePub downloads, according to the available data) and Abstracts Views on Vision4Press platform.
Data correspond to usage on the plateform after 2015. The current usage metrics is available 48-96 hours after online publication and is updated daily on week days.
Initial download of the metrics may take a while.