Fig. 6
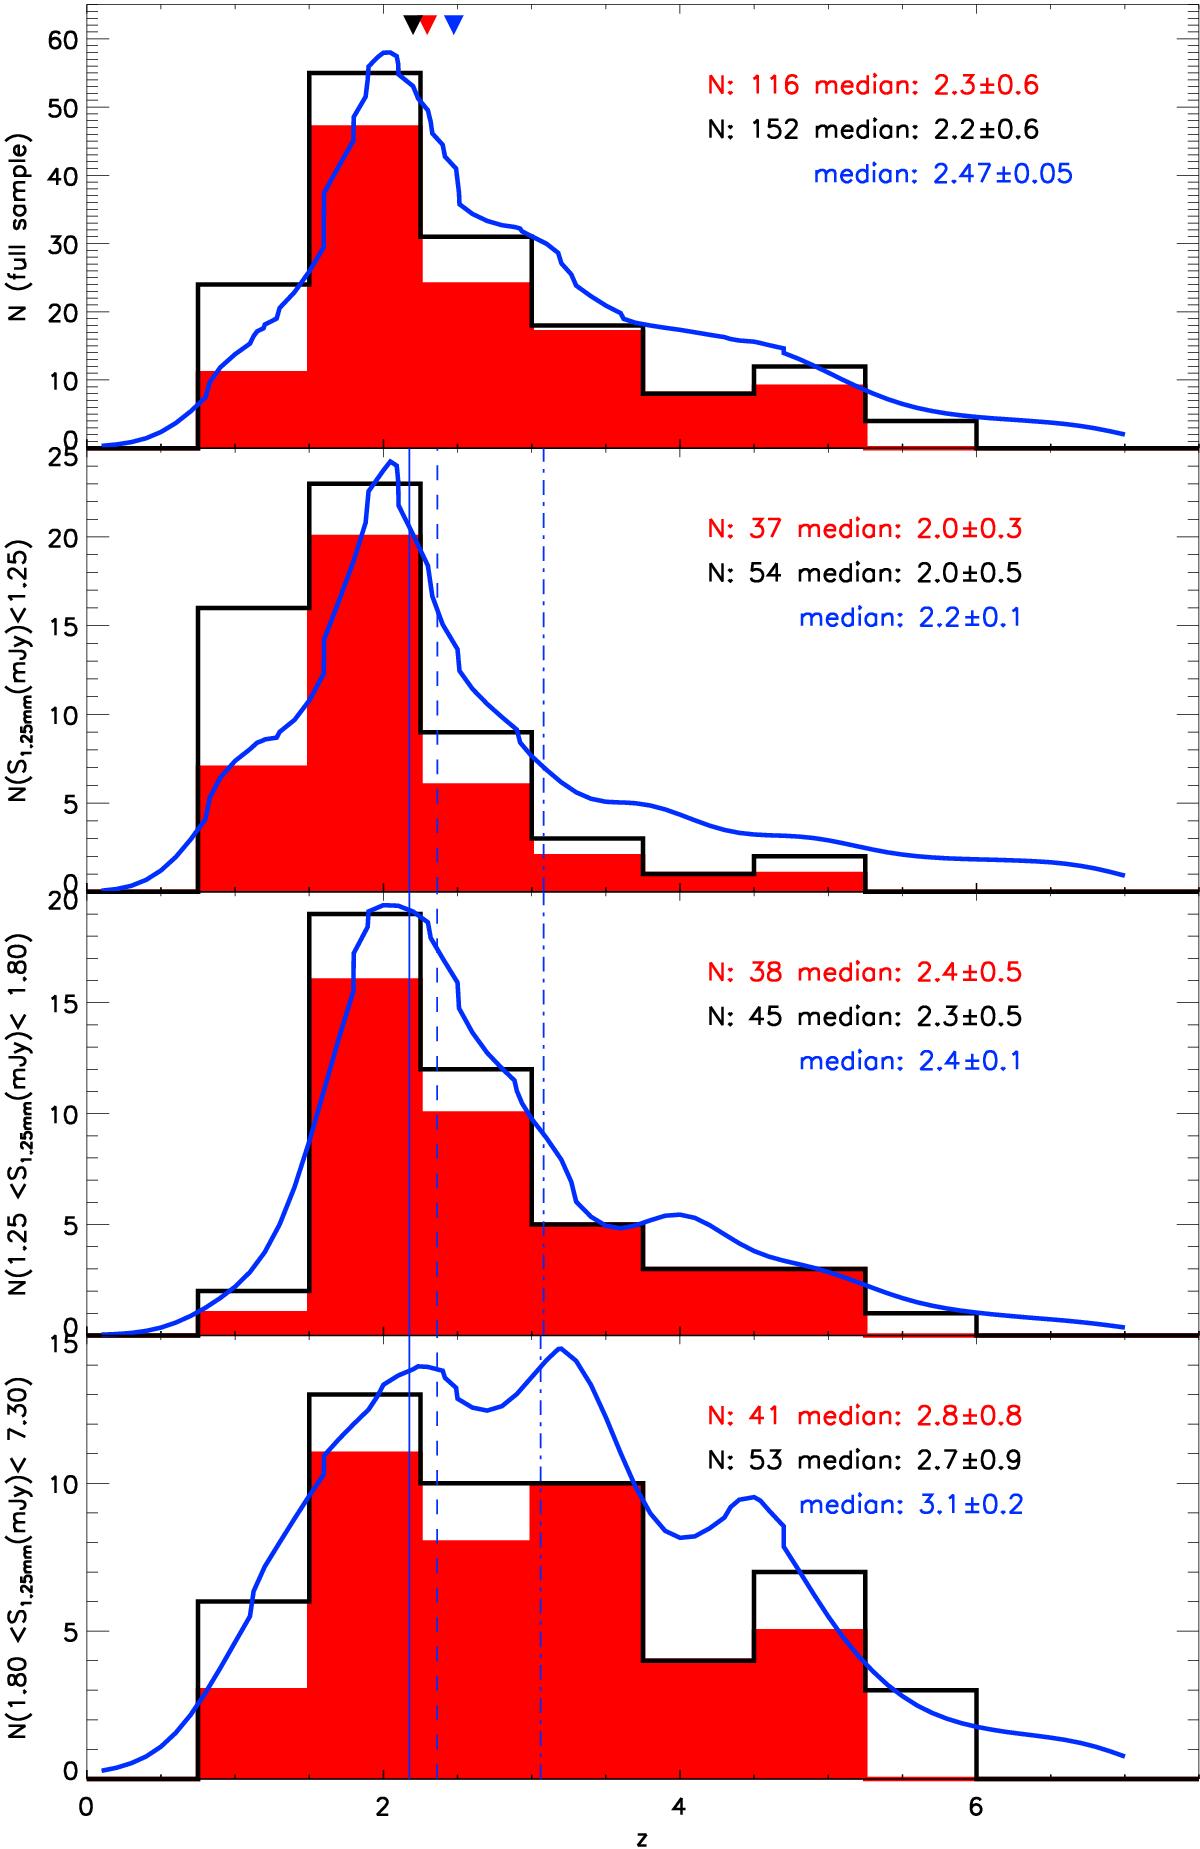
Top panel: redshift distribution of our full SMG sample. The filled red histogram includes only the 116 sources with spectroscopic or unambiguous photometric redshifts, our strict sample. The solid black line represents our extended sample, which additionally includes sources with radio-mm redshifts, FIR dust peak SEDs, less certain photometric redshifts, and sources which only have redshift lower limits. The smoothed blue line gives the redshift density likelihood function of the extended sample. Median values are noted in the figure and plotted as red, black, and blue colored triangles for the strict sample histogram, extended sample histogram, and the extended sample redshift density distribution (we note that the strict and extended sample histogram medians are nearly coincident). Bottom three panels: the redshift distributions of our samples subdivided by their ALMA 1.25 mm flux density. Sources with flux densities Sν < 1.25 mJy are shown in the second panel, 1.25 mJy ≤Sν ≤ 1.8 mJy in the third, and Sν > 1.8 mJy in the bottom panel. Our strict sample histogram, extended sample histogram, and redshift density likelihood function are plotted as in the top panel. Three blue vertical lines spanning all three panels show the redshift density distribution median redshifts for the various subsamples. Solid, dashed, and dot-dashed lines correspond to the faintest to brightest flux density divisions, respectively.
Current usage metrics show cumulative count of Article Views (full-text article views including HTML views, PDF and ePub downloads, according to the available data) and Abstracts Views on Vision4Press platform.
Data correspond to usage on the plateform after 2015. The current usage metrics is available 48-96 hours after online publication and is updated daily on week days.
Initial download of the metrics may take a while.